AUD Market Update
15 Jul 2026 • 00:29 GMT
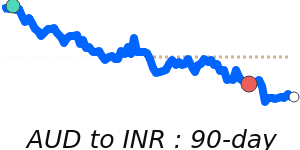
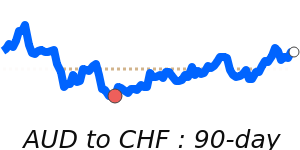
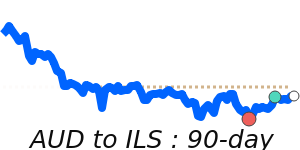
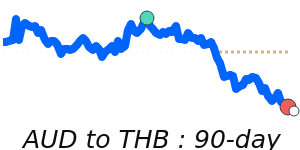
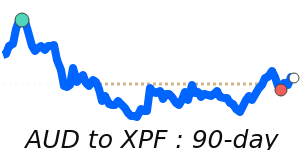
The Australian dollar has recently climbed to 14-day highs against the US dollar near 0.6976, though it remains about 1.5% below its three-month average of 0.7084. This move comes amid a period of relative stability, with the AUD/USD trading within a 5.4% range from 0.6887 to 0.7258.
Market focus continues to be on the influence of interest rates and risk sentiment. The AUD has faced some pressure as investors weigh the impact of recent economic data and potential RBA policy shifts, especially as inflation and employment figures influence expectations. Meanwhile, the US dollar remains supported by safe-haven flows amid geopolitical tensions, with the dollar settling into a range close to the DXY 101.50–102 level, boosted by cautious optimism around upcoming US CPI data.
Looking ahead, the AUD could see further volatility influenced by Australian economic reports, including CPI and employment data, as well as global factors such as US interest rates and geopolitical developments. However, for now, the dollar maintains its strength while the AUD tests resistance levels near recent highs.
📊 Quick forecast view
🔴 Mild downside
0.6980 – 0.7260
🌍 Global risk sentiment
⚪ Range-bound