MYR Market Update
19 May 2026 • 00:35 GMT
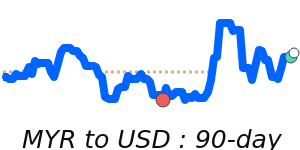
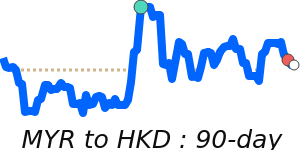
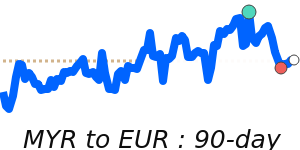
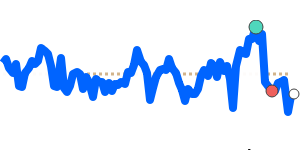
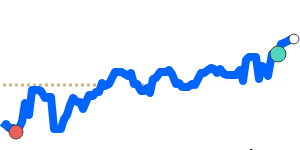
The Malaysian Ringgit remains near its 30-day lows against the US dollar, trading around 0.2514. While this is slightly below the three-month average of 0.2531, the movement has been quite stable within a narrow range. The recent strength of the US dollar, driven by robust US economic data and rising US treasury yields, continues to weigh on the ringgit. Investors are keeping an eye on US inflation and potential Federal Reserve rate hikes, which could sustain dollar strength in the near term.
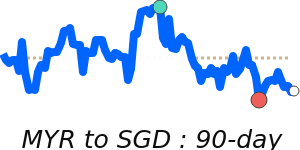
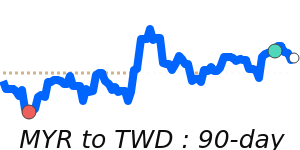
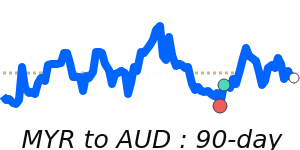
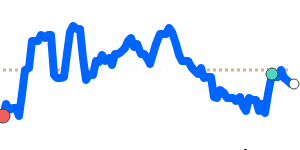
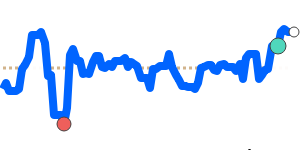
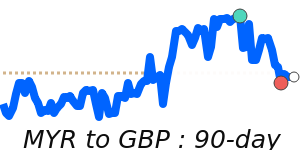
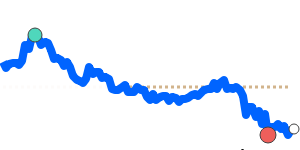
Meanwhile, the ringgit has held steady against other major currencies such as the euro and the British pound, with minimal changes observed. The currency’s support is underpinned by Malaysia’s resilient economic fundamentals, including steady growth prospects and positive foreign investment trends. Overall, expect the MYR to remain relatively steady, but still sensitive to US dollar movements and global risk sentiment.
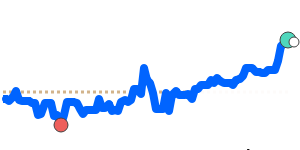
📊 Quick forecast view
🔴 Mild downside
0.2430 – 0.2530
🌍 Global risk sentiment
⚪ Range-bound