Latest market analysis
ZAR Market Update
03 Aug 2026 • 00:30 GMT
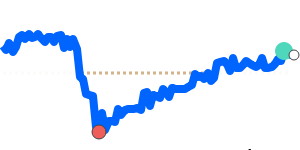
The South African rand has strengthened slightly against the US dollar, trading near 0.06075 — its highest level in the past week and close to its 3-month average. This move comes amid a stronger rand supported by rising commodity prices and South Africa’s improving economic outlook. The economy is forecasted to grow about 1.4% this year, driven by better infrastructure and electricity supply, which helps bolster confidence in the rand.
Meanwhile, the US dollar has been gaining ground ahead of the upcoming Federal Reserve meeting, with markets expecting a hawkish stance. Recent energy price increases and geopolitical tensions have supported dollar strength, pushing the USD to multi-month highs. This has caused some fluctuations in the dollar’s value against major currencies, but the rand’s recent gains suggest traders are still optimistic about South Africa’s economic prospects.
Looking ahead, the rand could continue to find support if commodity prices stay elevated or if South African economic data remain positive. However, any indications of more aggressive Fed rate hikes could pressure the rand in the near term. As always, stay attentive to global developments and local economic signals.
Forecast snapshot
Quick ZAR/USD forecast
Near-term bias🟢 Mild upside
Expected range0.0600 – 0.0630
Dominant driver🏦 Central bank policy divergence
3-month trend🟢 Uptrend
Stay informed
ZAR news & insights
Recent analysis, guides and market developments relevant to the South African rand.


Rate direction
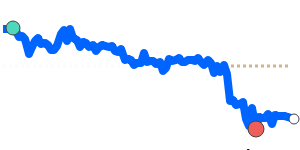
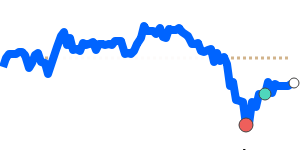
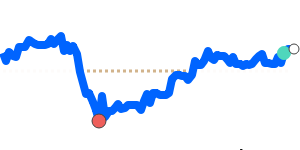
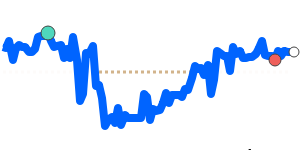
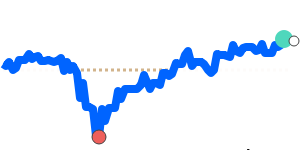
US dollar to South African rand · USD/ZAR trend
Review the recent market direction, current mid-market rate and significant movement alerts.
Compare before you exchange
Compare and save on ZAR exchange rates
Exchange rates vary between banks and currency providers. Use the comparison below to understand total costs and potential savings against typical bank pricing.
Loading exchange rates...
|
|
|
||
|
|
|
||
|
|
|
||
|
|
|
Explore ZAR pairs
Popular ZAR exchange rates
Open a currency pair to view its live rate, comparison options, recent trend and market context.
1 ZAR =0.060498USD
1D+0.6%▲
1 ZAR =0.052555EUR
1D+0.6%▲
1 ZAR =0.084967CAD
1D+0.4%▲
1 ZAR =0.045052GBP
1D+0.5%▲
1 ZAR =5.7665INR
1D+0.6%▲
1 ZAR =9.4886JPY
1D+0.7%▲
1 ZAR =0.086460AUD
1D+0.2%▲
1 ZAR =0.077596SGD
1D+0.4%▲
1 ZAR =0.4085CNY
1D+0.5%▲