SGD Market Update
06 Jul 2026 • 00:30 GMT
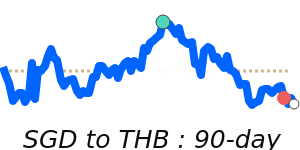
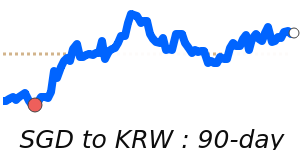
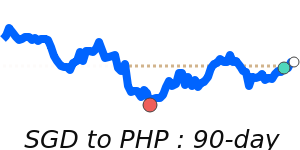
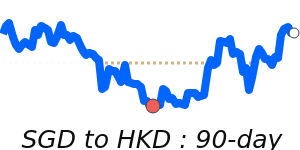
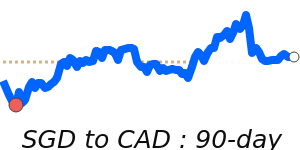
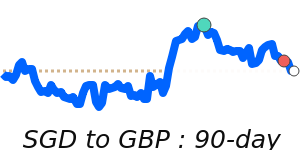
The Singapore Dollar is trading around 0.7741 against the US Dollar, slightly below its three-month average of 0.7808. Despite this, the SGD remains within a stable range, showing resilience amid fluctuations in the USD. The US Dollar has recently strengthened on expectations of continued US policy tightening but has faced some recent pressure as markets await clarity on upcoming Federal Reserve decisions.
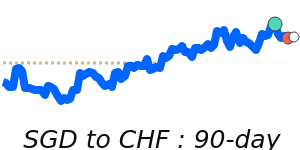
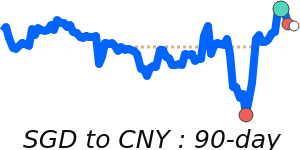
Singapore's currency has benefited from the country's solid economic fundamentals and the support from local monetary policy, with the SGD NEER trading above its midpoint. Analysts suggest that the SGD could see further gains if US dollar strength wanes. On the downside, if risk sentiment shifts or US economic data points to persistent strength, the SGD could face some pressure.
Overall, given current market conditions, expect the SGD to remain stable but watch for potential movements if US dollar momentum shifts or if local policy changes. The currency is near its recent multi-week lows but maintains strong support levels, reflecting a cautious but resilient outlook.
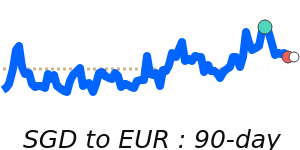
📊 Quick forecast view
🔴 Mild downside
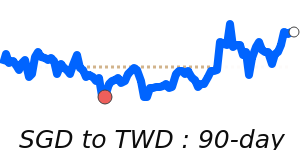
0.7750 – 0.7890
⚖️ Interest-rate differentials
🟢 Uptrend