Switch .com Best Exchange Rates .com Best Exchange Rates .com Best Exchange Rates
BER

    Australian dollar Exchange Update, Chart & History

    AUD Markets Update - Our review of Australian dollar Forecasts and News plus Charts and Historic Rates. Check AUD Trends over various time periods.


    Australian dollar (AUD) Market Update

    The Australian dollar (AUD) has experienced notable volatility recently, driven by a mix of geopolitical developments and shifting investor sentiment. Following U.S. President Donald Trump's announcement of a 10% tariff on Australian imports, the AUD initially faced downward pressure. However, optimism surrounding upcoming US-China trade talks provided some respite, allowing the currency to partially regain its footing. Despite these gains, the AUD could not maintain its strength as trading shifted into the European session.

    Current market dynamics continue to exert influence over the AUD, particularly in light of a hawkish interest rate decision from the Federal Reserve, which typically dampens the appeal of riskier assets like the Australian dollar. The lack of significant domestic economic data means that broader market trends will likely dictate the currency's performance in the near term. Analysts suggest that an anxious mood among investors may further contribute to a potential softening of the AUD.

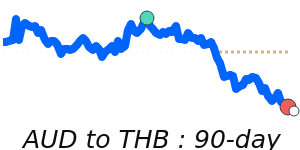
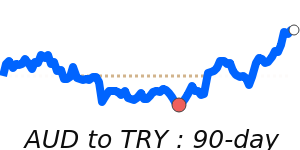
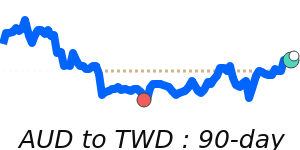
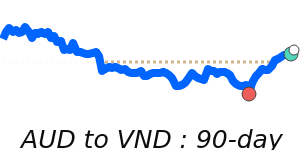
    Recent price action reflects the AUD's complex relationship with global economic factors. Against the U.S. dollar, the AUD is trading at 0.6394, which is 1.3% above its three-month average of 0.6314. This pair has experienced a volatile range of 9.0%, oscillating between 0.5957 and 0.6495. In contrast, the AUD to Euro exchange rate stands at 0.5695, 1.7% below its three-month average of 0.5796, having fluctuated in a significant 12.2% range. Similarly, the AUD to GBP rate is at 0.4830, 1.1% below its three-month average, demonstrating an 8.8% range. Meanwhile, the AUD to JPY is currently at 93.31, trading near its three-month average with an 11.4% range.

    As a commodity currency, the value of the AUD remains closely linked to the prices of key exports such as iron ore, coal, and natural gas. Strength in these sectors often bolsters the AUD, while declines can lead to depreciation. Ultimately, ongoing developments in global trade policies, shifting interest rate expectations, and economic performance, particularly in relation to China's economy, will be key factors shaping the AUD's trajectory moving forward. Investors should keep an eye on market sentiment and economic indicators as they navigate this volatile landscape.


    Australian dollar to US dollar - AUD/USD Trend

     
    AUD to USD at 0.6394 is 1.3% above its 3-month average of 0.6314, having traded in a fairly volatile 9.0% range from 0.5957 to 0.6495
    |
     
    1 AUD =
    0.6409We compare provider deals to this wholesale mid-market rate. Read more
    USD
     
    -0.5%
    90d-highs
     
    Track Rate

    View My Rate Tracker


    Compare & Save on Exchange Rates

    Exchange rates can vary significantly between banks and currency exchange providers, so it's important to compare rates from different sources before making a conversion.

    The below table makes it easy to calculate and compare the Total Cost you are being charged on currency rates and the possible savings of using a foreign exchange provider rather than your bank.


    Loading exchange rates...


    Top AUD Rates


    Australian dollar to US dollar
    AUDUSD 90 day chart

    AUD to USD at 0.6394 is 1.3% above its 3-month average of 0.6314, having traded in a fairly volatile 9.0% range from 0.5957 to 0.6495
    AUD to USD
    0.6409
    -0.5%
    90d-highs

    Australian dollar to Euro
    AUDEUR 90 day chart

    AUD to EUR at 0.5695 is 1.7% below its 3-month average of 0.5796, having traded in a rather volatile 12.2% range from 0.5436 to 0.6097
    AUD to EUR
    0.5696
    +0.2%
    30d-highs

    Australian dollar to Japanese yen
    AUDJPY 90 day chart

    AUD to JPY at 93.31 is near its 3-month average, having traded in a quite volatile 11.4% range from 87.14 to 97.05
    AUD to JPY
    92.99
    +1.0%

    Australian dollar to New Zealand dollar
    AUDNZD 90 day chart

    AUD to NZD at 1.0835 is just 0.9% below its 3-month average of 1.0934, having traded in a quite stable 4.4% range from 1.0671 to 1.1138
    AUD to NZD
    1.0859
    +0.2%

    Australian dollar to Indian rupee
    AUDINR 90 day chart

    AUD to INR at 55.01 is 1.1% above its 3-month average of 54.41, having traded in a relatively stable 7.8% range from 51.37 to 55.37
    AUD to INR
    54.75
    +0.9%
    30d-highs

    Australian dollar to Indonesian rupiah
    AUDIDR 90 day chart

    AUD to IDR is at 14-day lows near 10581, 1.3% above its 3-month average of 10447, having traded in a relatively stable 7.5% range from 10058 to 10808
    AUD to IDR
    10,587
    -0.2%
    14d-lows

    A-Z


    Australian dollar to Canadian dollar
    AUDCAD 90 day chart

    AUD to CAD at 0.8903 is just below its 3-month average, having traded in a relatively stable 7.4% range from 0.8496 to 0.9122
    AUD to CAD
    0.8916
    +0.1%
    30d-highs

    Australian dollar to Swiss franc
    AUDCHF 90 day chart

    AUD to CHF at 0.5317 is 2.8% below its 3-month average of 0.5468, having traded in a rather volatile 13.9% range from 0.5050 to 0.5751
    AUD to CHF
    0.5322
    +0.5%
    30d-highs

    Australian dollar to Chinese yuan
    AUDCNY 90 day chart

    AUD to CNY is at 14-day lows near 4.6186, just 0.6% above its 3-month average of 4.5931, having traded in a fairly volatile 8.4% range from 4.3713 to 4.7378
    AUD to CNY
    4.6305
    -0.5%
    14d-lows

    Australian dollar to Danish krone
    AUDDKK 90 day chart

    AUD to DKK at 4.2490 is 1.8% below its 3-month average of 4.3255, having traded in a quite volatile 12.0% range from 4.0589 to 4.5472
    AUD to DKK
    4.2490
    +0.2%
    30d-highs

    Australian dollar to Euro
    AUDEUR 90 day chart

    AUD to EUR at 0.5695 is 1.7% below its 3-month average of 0.5796, having traded in a rather volatile 12.2% range from 0.5436 to 0.6097
    AUD to EUR
    0.5696
    +0.2%
    30d-highs

    Australian dollar to Fijian dollar
    AUDFJD 90 day chart

    AUD to FJD is at 14-day highs near 1.4677, 1.3% above its 3-month average of 1.4488, having traded in a quite stable 6.0% range from 1.3905 to 1.4742
    AUD to FJD
    1.4559
    +1.4%
    14d-highs

    Australian dollar to British pound
    AUDGBP 90 day chart

    AUD to GBP at 0.4830 is 1.1% below its 3-month average of 0.4882, having traded in a fairly volatile 8.8% range from 0.4666 to 0.5077
    AUD to GBP
    0.4832
    -0.1%
    30d-highs

    Australian dollar to Hong Kong dollar
    AUDHKD 90 day chart

    AUD to HKD at 4.9714 is 1.3% above its 3-month average of 4.9065, having traded in a fairly volatile 8.8% range from 4.6291 to 5.0352
    AUD to HKD
    4.9839
    -0.3%
    90d-highs

    Australian dollar to Indonesian rupiah
    AUDIDR 90 day chart

    AUD to IDR is at 14-day lows near 10581, 1.3% above its 3-month average of 10447, having traded in a relatively stable 7.5% range from 10058 to 10808
    AUD to IDR
    10,587
    -0.2%
    14d-lows

    Australian dollar to Israeli new sheqel
    AUDILS 90 day chart

    AUD to ILS is at 14-day lows near 2.2887, just below its 3-month average, having traded in a relatively stable 6.7% range from 2.2291 to 2.3795
    AUD to ILS
    2.2873
    -0.7%
    14d-lows

    Australian dollar to Indian rupee
    AUDINR 90 day chart

    AUD to INR at 55.01 is 1.1% above its 3-month average of 54.41, having traded in a relatively stable 7.8% range from 51.37 to 55.37
    AUD to INR
    54.75
    +0.9%
    30d-highs

    Australian dollar to Japanese yen
    AUDJPY 90 day chart

    AUD to JPY at 93.31 is near its 3-month average, having traded in a quite volatile 11.4% range from 87.14 to 97.05
    AUD to JPY
    92.99
    +1.0%

    Australian dollar to Mexican peso
    AUDMXN 90 day chart

    AUD to MXN is at 7-day lows near 12.49, 1.8% below its 3-month average of 12.72, having traded in a quite stable 5.5% range from 12.33 to 13.01
    AUD to MXN
    12.51
    -0.8%

    Australian dollar to Malaysian ringgit
    AUDMYR 90 day chart

    AUD to MYR at 2.7368 is 1.7% below its 3-month average of 2.7839, having traded in a relatively stable 6.4% range from 2.6652 to 2.8369
    AUD to MYR
    2.7577
    +0.4%

    Australian dollar to New Zealand dollar
    AUDNZD 90 day chart

    AUD to NZD at 1.0835 is just 0.9% below its 3-month average of 1.0934, having traded in a quite stable 4.4% range from 1.0671 to 1.1138
    AUD to NZD
    1.0859
    +0.2%

    Australian dollar to Philippine peso
    AUDPHP 90 day chart

    AUD to PHP is at 14-day lows near 35.60, 1.3% below its 3-month average of 36.09, having traded in a relatively stable 8.0% range from 34.29 to 37.03
    AUD to PHP
    35.51
    -0.2%
    14d-lows

    Australian dollar to Pakistani rupee
    AUD to PKR at 180.3 is 1.9% above its 3-month average of 177, having traded in a fairly volatile 9.5% range from 167.2 to 183.1
    AUD to PKR
    180.66
    -0.4%
    90d-highs

    Australian dollar to Solomon Islands dollar
    AUD to SBD at 5.3265 is just 0.6% above its 3-month average of 5.2957, having traded in a fairly volatile 9.2% range from 4.9540 to 5.4100
    AUD to SBD
    5.3385
    -0.5%
    90d-highs

    Australian dollar to Swedish krona
    AUDSEK 90 day chart

    AUD to SEK at 6.2305 is 2.5% below its 3-month average of 6.3927, having traded in a very volatile 15.1% range from 5.9745 to 6.8791
    AUD to SEK
    6.2096
    +0.3%

    Australian dollar to Singapore dollar
    AUDSGD 90 day chart

    AUD to SGD is at 14-day lows near 0.8313, just 1.0% below its 3-month average of 0.8396, having traded in a quite stable 5.8% range from 0.8063 to 0.8534
    AUD to SGD
    0.8320
    14d-lows

    Australian dollar to Thai baht
    AUDTHB 90 day chart

    AUD to THB at 21.14 is just 0.6% below its 3-month average of 21.27, having traded in a quite stable 4.3% range from 20.76 to 21.65
    AUD to THB
    21.17
    14d-lows

    Australian dollar to Turkish lira
    AUDTRY 90 day chart

    AUD to TRY at 24.76 is 4.9% above its 3-month average of 23.61, having traded in a quite volatile 11.5% range from 22.50 to 25.08
    AUD to TRY
    24.83
    -0.3%
    90d-highs

    Australian dollar to New Taiwan dollar
    AUDTWD 90 day chart

    AUD to TWD at 19.36 is 5.8% below its 3-month average of 20.55, having traded in a quite volatile 11.5% range from 18.88 to 21.05
    AUD to TWD
    19.39
    -0.9%

    Australian dollar to US dollar
    AUDUSD 90 day chart

    AUD to USD at 0.6394 is 1.3% above its 3-month average of 0.6314, having traded in a fairly volatile 9.0% range from 0.5957 to 0.6495
    AUD to USD
    0.6409
    -0.5%
    90d-highs

    Australian dollar to Vietnamese dong
    AUDVND 90 day chart

    AUD to VND is at 14-day lows near 16596, 2.4% above its 3-month average of 16214, having traded in a fairly volatile 9.2% range from 15447 to 16866
    AUD to VND
    16,642
    -0.4%
    14d-lows

    Australian dollar to Samoan tala
    AUD to WST at 1.7904 is 1.3% above its 3-month average of 1.768, having traded in a fairly volatile 9.0% range from 1.6679 to 1.8185
    AUD to WST
    1.7944
    -0.5%
    90d-highs

    Australian dollar to CFP franc
    AUDXPF 90 day chart

    AUD to XPF at 67.96 is 1.7% below its 3-month average of 69.16, having traded in a rather volatile 12.1% range from 64.87 to 72.75
    AUD to XPF
    67.97
    +0.2%
    30d-highs

    Australian dollar to South African rand
    AUDZAR 90 day chart

    AUD to ZAR is at 30-day lows near 11.65, just below its 3-month average, having traded in a quite stable 5.8% range from 11.42 to 12.08
    AUD to ZAR
    11.65
    -0.7%
    30d-lows