Switch .com Best Exchange Rates .com Best Exchange Rates .com Best Exchange Rates
BER

    British pound Exchange Update, Chart & History

    GBP Markets Update - Our review of British pound Forecasts and News plus Charts and Historic Rates. Check GBP Trends over various time periods.


    British pound (GBP) Market Update

    The British pound (GBP) has recently experienced a rally despite news of a Bank of England (BoE) interest rate cut, following a trade announcement from U.S. President Donald Trump. Analysts note that the market reacted positively to Trump's declaration of a trade agreement with the UK, which was described as "the first of many." Although a 10% tariff on UK imports remains effective, this agreement has sparked optimism, leading to a rebound in the pound's value.

    Market sentiment has shifted, as the BoE's recent meeting, where two policymakers voted to keep rates unchanged and the bank revised its inflation forecast modestly, resulted in expectations of only two further rate cuts in 2025. This is a decrease from earlier expectations. With these factors in play, some traders are now cautiously optimistic about the pound's prospects.

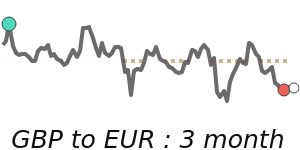
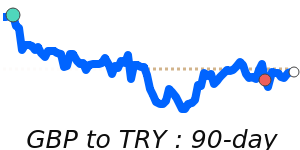
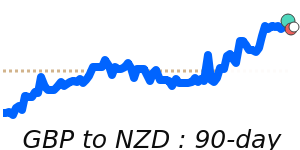
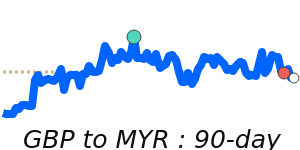
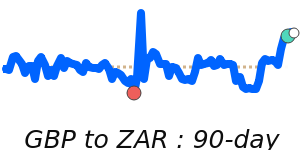
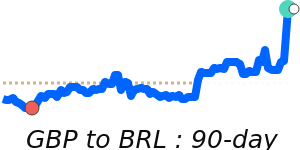
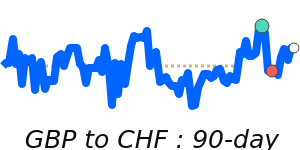
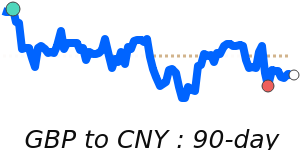
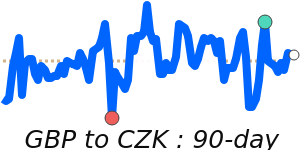
    Current price data reflects that GBP/USD is trading near 14-day lows at approximately 1.3237, which is 2.3% above its three-month average of 1.2938. In the past few weeks, the pair has shown volatility, fluctuating in an 8.7% range between 1.2366 and 1.3443. The GBP to EUR exchange is at 1.1792, just 0.7% below its three-month average of 1.187, indicating a relatively stable performance within a 5.3% range. Meanwhile, GBP to JPY is noted at 193.2, registering 1.3% above its three-month average, trading in a stable 4.8% range from 186.7 to 195.6.

    Looking ahead, attention will be on the upcoming speech from BoE Governor Andrew Bailey, as any indications of further rate cuts could exert downward pressure on the pound. Traders remain aware that the GBP's performance is highly sensitive to both domestic economic conditions and international developments, particularly as the UK continues to navigate its post-Brexit trade landscape. With ongoing uncertainties surrounding global trade and economic growth, the pound's trajectory will depend on a multitude of factors, including investor confidence and the BoE’s monetary policy direction.


    British pound to US dollar - GBP/USD Trend

     
    GBP to USD is at 14-day lows near 1.3237, 2.3% above its 3-month average of 1.2938, having traded in a fairly volatile 8.7% range from 1.2366 to 1.3443
    |
     
    1 GBP =
    1.3311We compare provider deals to this wholesale mid-market rate. Read more
    USD
     
    -0.4%
    14d-lows
     
    Track Rate

    View My Rate Tracker


    Compare & Save on Exchange Rates

    Exchange rates can vary significantly between banks and currency exchange providers, so it's important to compare rates from different sources before making a conversion.

    The below table makes it easy to calculate and compare the Total Cost you are being charged on currency rates and the possible savings of using a foreign exchange provider rather than your bank.


    Loading exchange rates...


    Top GBP Rates


    British pound to US dollar
    GBPUSD 90 day chart

    GBP to USD is at 14-day lows near 1.3237, 2.3% above its 3-month average of 1.2938, having traded in a fairly volatile 8.7% range from 1.2366 to 1.3443
    GBP to USD
    1.3311
    -0.4%
    14d-lows

    British pound to Euro
    GBPEUR 90 day chart

    GBP to EUR at 1.1792 is just 0.7% below its 3-month average of 1.187, having traded in a quite stable 5.3% range from 1.1517 to 1.2127
    GBP to EUR
    1.1822
    +0.3%
    30d-highs

    British pound to Australian dollar
    GBPAUD 90 day chart

    GBP to AUD at 2.0705 is 1.0% above its 3-month average of 2.0492, having traded in a fairly volatile 8.8% range from 1.9696 to 2.1430
    GBP to AUD
    2.0744
    +0.1%
    30d-lows

    British pound to Canadian dollar
    GBPCAD 90 day chart

    GBP to CAD is at 7-day highs near 1.8443, just 0.6% above its 3-month average of 1.8316, having traded in a quite stable 5.7% range from 1.7696 to 1.8701
    GBP to CAD
    1.8545
    +0.2%

    British pound to Indian rupee
    GBPINR 90 day chart

    GBP to INR at 113.9 is 2.2% above its 3-month average of 111.5, having traded in a relatively stable 6.2% range from 108.0 to 114.7
    GBP to INR
    113.77
    +1.1%

    British pound to Turkish lira
    GBPTRY 90 day chart

    GBP to TRY at 51.26 is 5.9% above its 3-month average of 48.39, having traded in a very volatile 16.1% range from 44.50 to 51.67
    GBP to TRY
    51.58
    -0.2%

    British pound to United Arab Emirates dirham
    GBPAED 90 day chart

    GBP to AED is at 14-day lows near 4.8619, 2.3% above its 3-month average of 4.7521, having traded in a fairly volatile 8.7% range from 4.5420 to 4.9378
    GBP to AED
    4.8892
    -0.4%
    14d-lows

    British pound to New Zealand dollar
    GBPNZD 90 day chart

    GBP to NZD at 2.2435 is near its 3-month average, having traded in a quite stable 5.4% range from 2.1892 to 2.3066
    GBP to NZD
    2.2500
    +0.3%
    60d-lows

    British pound to Malaysian ringgit
    GBPMYR 90 day chart

    GBP to MYR at 5.6665 is just 0.7% below its 3-month average of 5.704, having traded in a relatively stable 6.6% range from 5.5040 to 5.8653
    GBP to MYR
    5.7259
    +0.5%

    British pound to South African rand
    GBPZAR 90 day chart

    GBP to ZAR at 24.12 is just 0.5% above its 3-month average of 23.99, having traded in a quite volatile 10.7% range from 22.81 to 25.25
    GBP to ZAR
    24.31
    -0.7%
    30d-lows

    A-Z


    British pound to Australian dollar
    GBPAUD 90 day chart

    GBP to AUD at 2.0705 is 1.0% above its 3-month average of 2.0492, having traded in a fairly volatile 8.8% range from 1.9696 to 2.1430
    GBP to AUD
    2.0744
    +0.1%
    30d-lows

    British pound to Brazilian real
    GBPBRL 90 day chart

    GBP to BRL is at 14-day lows near 7.4948, just above its 3-month average, having traded in a quite volatile 11.3% range from 7.1573 to 7.9652
    GBP to BRL
    7.5196
    -1.8%
    14d-lows

    British pound to Canadian dollar
    GBPCAD 90 day chart

    GBP to CAD is at 7-day highs near 1.8443, just 0.6% above its 3-month average of 1.8316, having traded in a quite stable 5.7% range from 1.7696 to 1.8701
    GBP to CAD
    1.8545
    +0.2%

    British pound to Swiss franc
    GBPCHF 90 day chart

    GBP to CHF at 1.1009 is 1.7% below its 3-month average of 1.1197, having traded in a relatively stable 7.8% range from 1.0655 to 1.1490
    GBP to CHF
    1.1062
    +0.6%

    British pound to Chilean peso
    GBP to CLP is at 7-day lows near 1246, 1.5% above its 3-month average of 1227, having traded in a fairly volatile 8.4% range from 1189 to 1289
    GBP to CLP
    1,242.7
    -0.9%

    British pound to Chinese yuan
    GBPCNY 90 day chart

    GBP to CNY is at 14-day lows near 9.5642, 1.6% above its 3-month average of 9.4116, having traded in a fairly volatile 8.5% range from 9.0332 to 9.7971
    GBP to CNY
    9.6179
    -0.4%
    14d-lows

    British pound to Czech Republic horuna
    GBPCZK 90 day chart

    GBP to CZK at 29.38 is 1.1% below its 3-month average of 29.71, having traded in a quite stable 5.2% range from 28.92 to 30.43
    GBP to CZK
    29.50
    +0.4%
    14d-highs

    British pound to Danish krone
    GBPDKK 90 day chart

    GBP to DKK is at 30-day highs near 8.8008, just 0.7% below its 3-month average of 8.8586, having traded in a quite stable 5.2% range from 8.5991 to 9.0442
    GBP to DKK
    8.8194
    +0.3%
    30d-highs

    British pound to Euro
    GBPEUR 90 day chart

    GBP to EUR at 1.1792 is just 0.7% below its 3-month average of 1.187, having traded in a quite stable 5.3% range from 1.1517 to 1.2127
    GBP to EUR
    1.1822
    +0.3%
    30d-highs

    British pound to Hong Kong dollar
    GBPHKD 90 day chart

    GBP to HKD at 10.29 is 2.4% above its 3-month average of 10.05, having traded in a fairly volatile 8.3% range from 9.6323 to 10.43
    GBP to HKD
    10.35
    -0.3%

    British pound to Hungarian forint
    GBP to HUF is at 14-day highs near 478.4, near its 3-month average, having traded in a very stable 3.8% range from 471.2 to 489.3
    GBP to HUF
    477.59
    +0.6%
    14d-highs

    British pound to Indonesian rupiah
    GBPIDR 90 day chart

    GBP to IDR at 21915 is 2.4% above its 3-month average of 21410, having traded in a quite volatile 11.8% range from 20212 to 22588
    GBP to IDR
    21,991
    -0.1%

    British pound to Israeli new sheqel
    GBPILS 90 day chart

    GBP to ILS is at 30-day lows near 4.7395, just 0.6% above its 3-month average of 4.7112, having traded in a rather volatile 12.6% range from 4.4083 to 4.9619
    GBP to ILS
    4.7153
    -0.6%
    30d-lows

    British pound to Indian rupee
    GBPINR 90 day chart

    GBP to INR at 113.9 is 2.2% above its 3-month average of 111.5, having traded in a relatively stable 6.2% range from 108.0 to 114.7
    GBP to INR
    113.77
    +1.1%

    British pound to Japanese yen
    GBPJPY 90 day chart

    GBP to JPY at 193.2 is 1.3% above its 3-month average of 190.8, having traded in a quite stable 4.8% range from 186.7 to 195.6
    GBP to JPY
    193.44
    +1.0%

    British pound to Mexican peso
    GBPMXN 90 day chart

    GBP to MXN is at 30-day lows near 25.86, just 0.7% below its 3-month average of 26.05, having traded in a quite stable 4.6% range from 25.45 to 26.61
    GBP to MXN
    25.95
    -0.7%
    30d-lows

    British pound to Malaysian ringgit
    GBPMYR 90 day chart

    GBP to MYR at 5.6665 is just 0.7% below its 3-month average of 5.704, having traded in a relatively stable 6.6% range from 5.5040 to 5.8653
    GBP to MYR
    5.7259
    +0.5%

    British pound to Norwegian krone
    GBPNOK 90 day chart

    GBP to NOK at 13.81 is just 0.5% below its 3-month average of 13.88, having traded in a quite stable 5.2% range from 13.53 to 14.23
    GBP to NOK
    13.78
    +0.4%
    30d-lows

    British pound to New Zealand dollar
    GBPNZD 90 day chart

    GBP to NZD at 2.2435 is near its 3-month average, having traded in a quite stable 5.4% range from 2.1892 to 2.3066
    GBP to NZD
    2.2500
    +0.3%
    60d-lows

    British pound to Omani rial
    GBP to OMR is at 14-day lows near 0.5096, 2.3% above its 3-month average of 0.498, having traded in a fairly volatile 8.7% range from 0.4761 to 0.5176
    GBP to OMR
    0.5125
    -0.4%
    14d-lows

    British pound to Philippine peso
    GBPPHP 90 day chart

    GBP to PHP at 73.74 is just below its 3-month average, having traded in a quite stable 5.4% range from 71.91 to 75.82
    GBP to PHP
    73.72
    -0.1%

    British pound to Pakistani rupee
    GBPPKR 90 day chart

    GBP to PKR is at 14-day lows near 373.2, 2.9% above its 3-month average of 362.6, having traded in a fairly volatile 9.4% range from 345.5 to 377.9
    GBP to PKR
    375.24
    -0.4%
    14d-lows

    British pound to Polish zloty
    GBPPLN 90 day chart

    GBP to PLN at 5.0169 is just above its 3-month average, having traded in a relatively stable 7.9% range from 4.7144 to 5.0876
    GBP to PLN
    5.0048
    -0.1%

    British pound to Qatari rial
    GBP to QAR is at 14-day lows near 4.8196, 2.3% above its 3-month average of 4.7134, having traded in a fairly volatile 8.9% range from 4.5022 to 4.9014
    GBP to QAR
    4.8466
    -0.4%
    14d-lows

    British pound to Russian ruble
    GBPRUB 90 day chart

    GBP to RUB at 109.2 is 1.8% below its 3-month average of 111.2, having traded in a very volatile 15.2% range from 106.3 to 122.5
    GBP to RUB
    111.48
    +1.9%

    British pound to Saudi riyal
    GBPSAR 90 day chart

    GBP to SAR is at 14-day lows near 4.9654, 2.3% above its 3-month average of 4.8529, having traded in a fairly volatile 8.7% range from 4.6375 to 5.0427
    GBP to SAR
    4.9931
    -0.4%
    14d-lows

    British pound to Swedish krona
    GBPSEK 90 day chart

    GBP to SEK at 12.90 is 1.5% below its 3-month average of 13.09, having traded in a relatively stable 7.0% range from 12.75 to 13.64
    GBP to SEK
    12.92
    +0.4%

    British pound to Singapore dollar
    GBPSGD 90 day chart

    GBP to SGD at 1.7216 is near its 3-month average, having traded in a quite stable 4.9% range from 1.6765 to 1.7591
    GBP to SGD
    1.7271
    +0.1%

    British pound to Thai baht
    GBPTHB 90 day chart

    GBP to THB at 43.77 is just above its 3-month average, having traded in a relatively stable 7.2% range from 41.89 to 44.89
    GBP to THB
    43.86
    30d-lows

    British pound to Turkish lira
    GBPTRY 90 day chart

    GBP to TRY at 51.26 is 5.9% above its 3-month average of 48.39, having traded in a very volatile 16.1% range from 44.50 to 51.67
    GBP to TRY
    51.58
    -0.2%

    British pound to New Taiwan dollar
    GBP to TWD at 40.09 is 4.8% below its 3-month average of 42.12, having traded in a rather volatile 12.4% range from 38.80 to 43.61
    GBP to TWD
    40.18
    -0.8%

    British pound to US dollar
    GBPUSD 90 day chart

    GBP to USD is at 14-day lows near 1.3237, 2.3% above its 3-month average of 1.2938, having traded in a fairly volatile 8.7% range from 1.2366 to 1.3443
    GBP to USD
    1.3311
    -0.4%
    14d-lows

    British pound to Vietnamese dong
    GBPVND 90 day chart

    GBP to VND is at 14-day lows near 34368, 3.4% above its 3-month average of 33228, having traded in a quite volatile 11.4% range from 31372 to 34954
    GBP to VND
    34,563
    -0.4%
    14d-lows

    British pound to Samoan tala
    GBP to WST is at 14-day lows near 3.7064, 2.3% above its 3-month average of 3.6227, having traded in a fairly volatile 8.7% range from 3.4625 to 3.7641
    GBP to WST
    3.7272
    -0.4%
    14d-lows

    British pound to Central African franc
    GBP to XAF at 773.5 is just 0.7% below its 3-month average of 778.6, having traded in a quite stable 5.3% range from 755.5 to 795.5
    GBP to XAF
    775.45
    +0.3%
    30d-highs

    British pound to East Caribbean dollar
    GBPXCD 90 day chart

    GBP to XCD is at 14-day lows near 3.5740, 2.3% above its 3-month average of 3.4959, having traded in a fairly volatile 8.6% range from 3.3420 to 3.6297
    GBP to XCD
    3.5941
    -0.4%
    14d-lows

    British pound to West African franc
    GBP to XOF at 773.5 is just 0.7% below its 3-month average of 778.6, having traded in a quite stable 5.3% range from 755.5 to 795.5
    GBP to XOF
    775.45
    +0.3%
    30d-highs

    British pound to South African rand
    GBPZAR 90 day chart

    GBP to ZAR at 24.12 is just 0.5% above its 3-month average of 23.99, having traded in a quite volatile 10.7% range from 22.81 to 25.25
    GBP to ZAR
    24.31
    -0.7%
    30d-lows