Switch .com Best Exchange Rates .com Best Exchange Rates .com Best Exchange Rates
BER

    Mexican peso Exchange Update, Chart & History

    MXN Markets Update - Our review of Mexican peso Forecasts and News plus Charts and Historic Rates. Check MXN Trends over various time periods.


    Mexican peso (MXN) Market Update

    The Mexican peso (MXN) has recently experienced significant volatility, primarily influenced by the shifting dynamics in US-Mexico trade relations. The instability stemmed from President Claudia Sheinbaum’s announcement of potential retaliatory measures against the United States following new tariffs imposed by the Trump administration. Initially, this uncertainty led to a decline in the peso against the US dollar. However, the currency rebounded as US Commerce Secretary Howard Lutnick indicated that these tariffs may be eased, sparking optimism for negotiations between the two nations.

    Analysts note a notable shift in the trade discourse, as President Trump agreed to delay the implementation of the 25% tariffs for one month, a decision made after a conversation with Sheinbaum. In a reciprocal gesture, Mexico has committed to deploying 10,000 troops to the US border to address concerns over fentanyl and migration. This development has led to a rally in riskier currencies, with the peso leading the charge.

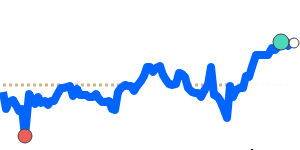
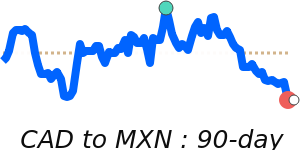
    In terms of recent trading metrics, the MXN to USD exchange rate has reached 90-day highs at approximately 0.051434, reflecting a 3.4% increase above its three-month average of 0.049753. This pair has oscillated within a 7.2% range, trading between 0.047972 and 0.051434. Meanwhile, the MXN to EUR stands at 0.045794, which is just 0.6% above its three-month average of 0.045536, revealing a more volatile trading range of 9.0%, between 0.043332 and 0.047252.

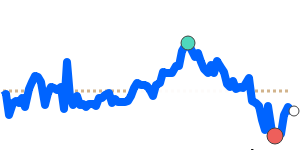
    Additionally, the strength of the peso against the British pound has reached 30-day highs around 0.038716, slightly up by 0.9% from its three-month average, while maintaining a stable range of 4.6%, from 0.037579 to 0.039298. The MXN to JPY shows a similar trend, trading at 7.5013, which is 2.4% above its three-month average of 7.3282 and within a range from 7.0176 to 7.5209.

    Overall, market participants are closely monitoring developments in US-Mexico negotiations, as expectations build that the tariffs will not remain in place long-term. These factors will likely continue to drive volatility in the peso as economic conditions evolve.


    US dollar to Mexican peso - USD/MXN Trend

     
    USD to MXN is at 90-day lows near 19.44, 3.3% below its 3-month average of 20.11, having traded in a relatively stable 7.3% range from 19.44 to 20.85
    |
     
    1 USD =
    19.46We compare provider deals to this wholesale mid-market rate. Read more
    MXN
     
    90d-lows
     
    Track Rate

    View My Rate Tracker


    Compare & Save on Exchange Rates

    Exchange rates can vary significantly between banks and currency exchange providers, so it's important to compare rates from different sources before making a conversion.

    The below table makes it easy to calculate and compare the Total Cost you are being charged on currency rates and the possible savings of using a foreign exchange provider rather than your bank.


    Loading exchange rates...


    Top MXN Rates


    Mexican peso to US dollar
    MXNUSD 90 day chart

    MXN to USD is at 90-day highs near 0.051434, 3.4% above its 3-month average of 0.049753, having traded in a relatively stable 7.2% range from 0.047972 to 0.051434
    MXN to USD
    0.051376
    90d-highs

    US dollar to Mexican peso
    USDMXN 90 day chart

    USD to MXN is at 90-day lows near 19.44, 3.3% below its 3-month average of 20.11, having traded in a relatively stable 7.3% range from 19.44 to 20.85
    USD to MXN
    19.46
    90d-lows

    Canadian dollar to Mexican peso
    CADMXN 90 day chart

    CAD to MXN at 13.96 is 1.8% below its 3-month average of 14.21, having traded in a quite stable 5.8% range from 13.85 to 14.66
    CAD to MXN
    13.98
    +0.1%
    30d-lows

    Euro to Mexican peso
    EURMXN 90 day chart

    EUR to MXN at 21.84 is just 0.6% below its 3-month average of 21.97, having traded in a fairly volatile 9.1% range from 21.16 to 23.08
    EUR to MXN
    21.86
    -0.1%
    30d-lows

    A-Z


    Mexican peso to Canadian dollar
    MXNCAD 90 day chart

    MXN to CAD at 0.071622 is 1.8% above its 3-month average of 0.070374, having traded in a quite stable 5.9% range from 0.068202 to 0.072202
    MXN to CAD
    0.071528
    -0.1%
    30d-highs

    Mexican peso to US dollar
    MXNUSD 90 day chart

    MXN to USD is at 90-day highs near 0.051434, 3.4% above its 3-month average of 0.049753, having traded in a relatively stable 7.2% range from 0.047972 to 0.051434
    MXN to USD
    0.051376
    90d-highs