Switch .com Best Exchange Rates .com Best Exchange Rates .com Best Exchange Rates
BER

Exchange Rate Trends & Alerts

Follow currency pairs trends with recent price movements and 90-day alerts.

How does the BER Rate Tracker work?

Exchange rates are highly volatile, often shifting dramatically from one day to the next. Timing your foreign exchange transaction well can make a real difference to how much you receive. That’s where the BER Rate Tracker comes in—it helps you stay informed and take advantage of the best possible rates.

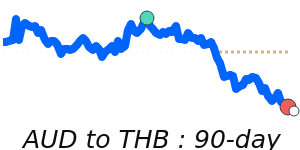
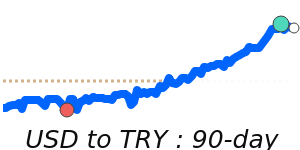
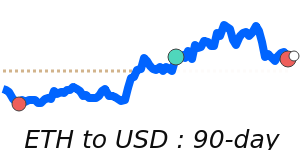
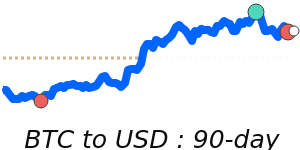
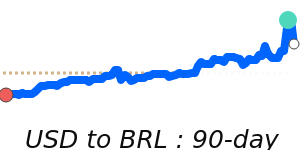
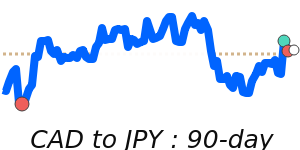
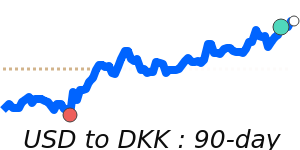
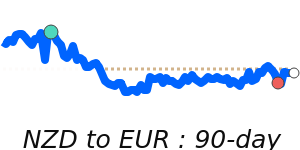
Once you set up your alerts, the BER Rate Tracker will monitor your selected currency pair and send you daily email updates. You’ll get notified whenever there’s a significant change in the exchange rate that matters to you. Each alert also includes an easy-to-read summary of recent trends, showing whether rates have been moving UP 📈 or DOWN 📉 over various time frames, up to 90 days.

Unlike traditional FX alerts that rely on a single target rate, our tracker keeps working continuously, helping you make smarter, better-timed decisions—whether you're planning a one-off transfer or keeping an eye on rates regularly.

With the BER Rate Tracker, you stay informed without the hassle of constant monitoring—your currency updates come straight to your inbox, ready when you need them.

With daily email alerts, you'll be notified when your chosen currency experiences a notable change. Each alert also highlights recent trends—showing whether rates have been trending UP 📈 or DOWN 📉 over periods of up to 90 days—giving you valuable context at a glance.

How Are Our Rate Alerts Different?

Unlike most FX alerts that require you to set a specific target rate, our Smart Rate Tracker does the work for you. It automatically notifies you when significant movements happen in your chosen currency—whether it hits a new daily high/low or shifts noticeably (up or down) over various periods, up to 90 days. No need to set or constantly update a target rate—our alerts keep working in the background as exchange rates evolve.

Why a 90-Day Window?

For most transfers and currency exchanges, the past 90 days provide the most relevant snapshot of rate trends. While longer-term trends may interest traders, we focus on what matters most to typical users: timely, practical insights for near-term FX transactions. By keeping alerts within a 90-day scope, we ensure they're simple, relevant, and actionable.

Setup your Rate Tracker

You can choose to receive daily emails (Monday to Saturday) or opt for alerts only when a new trend emerges. Emails are sent around the New York market close, which is traditionally considered the end of the FX trading day—ensuring you get the latest, most relevant updates.

There are plenty of smart ways to use the BER Rate Tracker to save money. For example, you might split a large transfer into smaller amounts, sending funds when the rate improves or hits a short-term high. Or you can pre-load a travel money card when rates are in your favor, locking in value ahead of a future trip.

If you have any questions or suggestions regarding these alerts please contact us here.


Follow exchange rates via your personal BER Rate Tracker to keep track of trending currency pairs so that you can take advantage of opportunities and trends in the market.


Track Popular Exchange Rates


British pound to US dollar
GBPUSD 90 day chart

GBP to USD is at 90-day highs near 1.3580, 2.9% above its 3-month average of 1.3191, having traded in a relatively stable 6.7% range from 1.2725 to 1.3580
GBP to USD
1.3543
+0.2%
90d-highs

Australian dollar to US dollar
AUDUSD 90 day chart

AUD to USD is at 90-day highs near 0.6513, 2.4% above its 3-month average of 0.6359, having traded in a fairly volatile 9.3% range from 0.5957 to 0.6513
AUD to USD
0.6491
+0.3%
90d-highs

British pound to US dollar
GBPUSD 90 day chart

GBP to USD is at 90-day highs near 1.3580, 2.9% above its 3-month average of 1.3191, having traded in a relatively stable 6.7% range from 1.2725 to 1.3580
GBP to USD
1.3543
+0.2%
90d-highs

US dollar to Turkish lira
USDTRY 90 day chart

USD to TRY is at 90-day highs near 39.29, 2.8% above its 3-month average of 38.21, having traded in a relatively stable 7.8% range from 36.45 to 39.29
USD to TRY
39.27
+0.3%
90d-highs

US dollar to Hong Kong dollar
USDHKD 90 day chart

USD to HKD is at 90-day highs near 7.8466, just 0.8% above its 3-month average of 7.7853, having traded in a stable 1.2% range from 7.7500 to 7.8466
USD to HKD
7.8468
90d-highs

Euro to US dollar
EURUSD 90 day chart

EUR to USD is at 30-day highs near 1.1453, 2.6% above its 3-month average of 1.116, having traded in a relatively stable 7.1% range from 1.0754 to 1.1513
EUR to USD
1.1418
+0.3%
30d-highs

Canadian dollar to Japanese yen
CADJPY 90 day chart

CAD to JPY is at 14-day highs near 105.1, 1.2% above its 3-month average of 103.9, having traded in a quite stable 4.3% range from 101.8 to 106.2
CAD to JPY
105.38
+0.7%
14d-highs

Euro to Japanese yen
EURJPY 90 day chart

EUR to JPY is at 14-day highs near 164.4, 1.2% above its 3-month average of 162.5, having traded in a very stable 4.0% range from 158.6 to 165.0
EUR to JPY
164.53
+0.9%
14d-highs

Australian dollar to Japanese yen
AUDJPY 90 day chart

AUD to JPY is at 14-day highs near 93.52, 1.0% above its 3-month average of 92.59, having traded in a fairly volatile 9.5% range from 87.14 to 95.43
AUD to JPY
93.54
+0.9%
14d-highs

Australian dollar to Thai baht
AUDTHB 90 day chart

AUD to THB is at 14-day highs near 21.24, near its 3-month average, having traded in a quite stable 4.3% range from 20.76 to 21.65
AUD to THB
21.16
+0.3%
14d-highs

Australian dollar to British pound
AUDGBP 90 day chart

AUD to GBP is at 14-day highs near 0.4798, just 0.5% below its 3-month average of 0.482, having traded in a quite stable 5.3% range from 0.4666 to 0.4914
AUD to GBP
0.4793
+0.1%
14d-highs

US dollar to Canadian dollar
USDCAD 90 day chart

USD to CAD is at 90-day lows near 1.3666, 2.5% below its 3-month average of 1.4016, having traded in a quite stable 5.7% range from 1.3666 to 1.4441
USD to CAD
1.3674
-0.1%
90d-lows

US dollar to Mexican peso
USDMXN 90 day chart

USD to MXN is at 90-day lows near 19.15, 3.3% below its 3-month average of 19.8, having traded in a fairly volatile 8.9% range from 19.15 to 20.85
USD to MXN
19.14
-0.3%
90d-lows

US dollar to Brazilian real
USDBRL 90 day chart

USD to BRL is at 90-day lows near 5.5847, 2.4% below its 3-month average of 5.7246, having traded in a relatively stable 7.6% range from 5.5847 to 6.0113
USD to BRL
5.5891
-0.9%
90d-lows

US dollar to Chinese yuan
USDCNY 90 day chart

USD to CNY is at 90-day lows near 7.1760, 1.0% below its 3-month average of 7.2505, having traded in a very stable 2.4% range from 7.1760 to 7.3499
USD to CNY
7.1823
-0.1%
90d-lows

US dollar to Danish krone
USDDKK 90 day chart

USD to DKK is at 30-day lows near 6.5132, 2.6% below its 3-month average of 6.6909, having traded in a relatively stable 7.0% range from 6.4849 to 6.9375
USD to DKK
6.5326
-0.3%
30d-lows

Etherium to US dollar
ETHUSD 90 day chart

ETH to USD at 2412 is 17.7% above its 3-month average of 2050, having traded in a highly volatile 81.9% range from 1479 to 2690
ETH to USD
2,485.9
-7.4%

Bitcoin to US dollar
BTCUSD 90 day chart

BTC to USD at 101491 is 9.3% above its 3-month average of 92843, having traded in a highly volatile 44.3% range from 77000 to 111098
BTC to USD
103,842
-3.0%

Hong Kong dollar to Japanese yen
HKDJPY 90 day chart

HKD to JPY at 18.30 is 2.2% below its 3-month average of 18.71, having traded in a relatively stable 7.0% range from 18.15 to 19.42
HKD to JPY
18.36
+0.6%
30d-lows

Australian dollar to New Zealand dollar
AUDNZD 90 day chart

AUD to NZD at 1.0776 is just 0.8% below its 3-month average of 1.0858, having traded in a very stable 3.5% range from 1.0671 to 1.1045
AUD to NZD
1.0767
30d-lows

US dollar to Japanese yen
USDJPY 90 day chart

USD to JPY at 143.6 is 1.4% below its 3-month average of 145.6, having traded in a relatively stable 7.2% range from 140.9 to 151.0
USD to JPY
144.10
+0.6%

Australian dollar to Euro
AUDEUR 90 day chart

AUD to EUR is at 7-day highs near 0.5687, just below its 3-month average, having traded in a relatively stable 7.7% range from 0.5436 to 0.5857
AUD to EUR
0.5685

US dollar to Swiss franc
USDCHF 90 day chart

USD to CHF at 0.8195 is 2.9% below its 3-month average of 0.8441, having traded in a fairly volatile 9.4% range from 0.8092 to 0.8851
USD to CHF
0.8213
+0.1%

Euro to Canadian dollar
EURCAD 90 day chart

EUR to CAD at 1.5650 is near its 3-month average, having traded in a very stable 3.9% range from 1.5342 to 1.5937
EUR to CAD
1.5614
+0.2%

Canadian dollar to Australian dollar
CADAUD 90 day chart

CAD to AUD at 1.1236 is near its 3-month average, having traded in a relatively stable 7.4% range from 1.0963 to 1.1770
CAD to AUD
1.1266
-0.2%

United Arab Emirates dirham to Indian rupee
AEDINR 90 day chart

AED to INR is at 7-day highs near 23.39, just above its 3-month average, having traded in a very stable 3.7% range from 22.93 to 23.78
AED to INR
23.33

Euro to British pound
EURGBP 90 day chart

EUR to GBP at 0.8433 is just below its 3-month average, having traded in a quite stable 4.2% range from 0.8337 to 0.8683
EUR to GBP
0.8431
+0.1%

US dollar to Singapore dollar
USDSGD 90 day chart

USD to SGD at 1.2863 is 2.1% below its 3-month average of 1.3144, having traded in a quite stable 5.4% range from 1.2842 to 1.3535
USD to SGD
1.2861

US dollar to Philippine peso
USDPHP 90 day chart

USD to PHP is at 7-day lows near 55.64, 1.5% below its 3-month average of 56.48, having traded in a quite stable 4.3% range from 55.34 to 57.72
USD to PHP
55.81
-0.2%

Australian dollar to Chinese yuan
AUDCNY 90 day chart

AUD to CNY at 4.6734 is 1.4% above its 3-month average of 4.61, having traded in a fairly volatile 8.4% range from 4.3713 to 4.7378
AUD to CNY
4.6623
+0.2%

New Zealand dollar to Euro
NZDEUR 90 day chart

NZD to EUR is at 7-day highs near 0.5278, just 0.5% above its 3-month average of 0.5249, having traded in a quite stable 5.6% range from 0.5051 to 0.5334
NZD to EUR
0.5280

New Zealand dollar to British pound
NZDGBP 90 day chart

NZD to GBP at 0.4451 is just above its 3-month average, having traded in a very stable 3.9% range from 0.4335 to 0.4503
NZD to GBP
0.4452
+0.1%