
Latest market analysis
USD Market Update
03 Aug 2026 • 00:26 GMT
The US dollar has regained some ground as traders prepare for the upcoming Federal Open Market Committee (FOMC) meeting. Recent market movements show the USD climbing close to its year-to-date highs, supported by expectations that the Fed may signal further rate hikes. This renewed strength comes after a brief period of weakness, with the dollar holding steady against major currencies within recent ranges.
Against the euro, the USD has risen towards 0.8660, near its 30-day lows but still close to its 3-month average, reflecting cautious optimism among traders ahead of potential policy shifts. The Japanese yen remains below its 3-month average at 157.6, and the Australian dollar also stayed stable near 1.4191, both showing limited volatility in recent days.
Market analysts note that geopolitical tensions and energy prices continue to influence the dollar’s short-term moves. However, the main driver remains the market's anticipation of the Fed’s direction, with many expecting a hawkish tone that could support the USD further into the year. Traders should keep an eye on the Fed’s language and economic outlook following the meeting, as these will likely be key in determining the USD's near-term path.
Forecast snapshot
Quick USD/EUR forecast
Near-term bias🟢 Mild upside
Expected range0.8480 – 0.8660
Dominant driver🌍 Global risk sentiment
3-month trend🟢 Uptrend
Stay informed
USD news & insights
Recent analysis, guides and market developments relevant to the US dollar.


Rate direction
US Dollar Index · USD/X trend
Review the recent market direction, current mid-market rate and significant movement alerts.
Compare before you exchange
Compare and save on USD exchange rates
Exchange rates vary between banks and currency providers. Use the comparison below to understand total costs and potential savings against typical bank pricing.
Loading exchange rates...
|
|
|
||
|
|
|
||
|
|
|
||
|
|
|
Explore USD pairs
Popular USD exchange rates
Open a currency pair to view its live rate, comparison options, recent trend and market context.
1 USD =1.4033CAD

1D−0.1%▼
1 USD =0.8673EUR

1D−0.1%▼
1 USD =156.50JPY

1D+0.1%▲
1 USD =17.32MXN

1D−0.2%▼
1 USD =95.19INR

1D0.0%⬦
1 USD =0.7425GBP
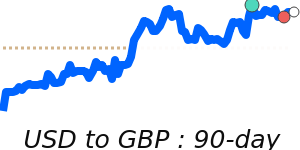
1D−0.1%▼
1 USD =1.4226AUD

1D−0.4%▼
1 USD =61.01PHP

1D0.0%⬦