Switch .com Best Exchange Rates .com Best Exchange Rates .com Best Exchange Rates
BER

    Canadian dollar Exchange Update, Chart & History

    CAD Markets Update - Our review of Canadian dollar Forecasts and News plus Charts and Historic Rates. Check CAD Trends over various time periods.


    Canadian dollar (CAD) Market Update

    The Canadian dollar (CAD), commonly known as the “loonie,” is currently experiencing downward pressure despite recovering oil prices. Analysts note that the CAD slid recently, possibly due to ongoing trade tensions with the United States, an issue that continues to weigh on investor sentiment. As traders turn their attention to Canada's latest unemployment figures, there is speculation that a potential rise in joblessness could further impact the currency.

    The loonie's value is intrinsically linked to commodity prices, particularly oil, given Canada's status as one of the world’s largest oil exporters. With crude prices currently trading at $62.84, the CAD might generally be expected to strengthen. However, the oil prices are 9.8% below their three-month average of $69.67, reflecting volatility in the commodities market that has seen a wide range from $60.14 to $76.99. This decline in oil prices tends to create downward pressure on the CAD, as decreased demand for Canadian exports diminishes economic support.

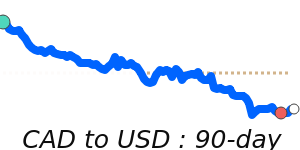
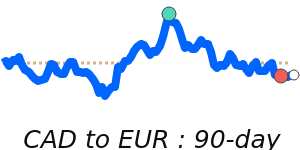
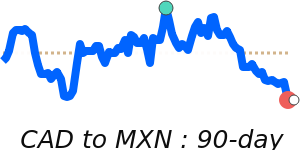
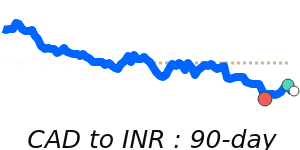
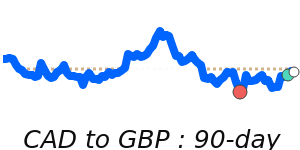
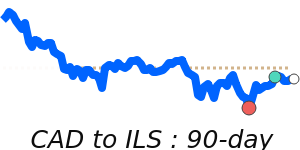
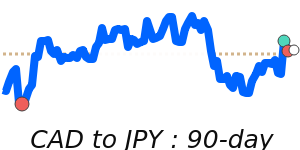
    Recent exchange rate data highlights some significant movements in key CAD currency pairs. The CAD is trading at 14-day lows against the USD at around 0.7181, which is 1.7% above its three-month average of 0.7064. In contrast, against the EUR, the CAD is 1.3% below its three-month average at 0.6397. The CAD has remained relatively stable against the GBP at 0.5425, just 0.7% below its average, and is trading at 104.8 JPY, slightly above its three-month average of 104.2. These dynamics underline the CAD's sensitivity to shifts in both domestic indicators and broader economic conditions.

    Looking ahead, market experts stress that the future performance of the CAD will depend heavily on oil market trends and Bank of Canada monetary policy decisions. With significant trading relationships and economic ties to the U.S., the performance of the U.S. economy and its policies will continue to play a crucial role in determining the loonie's trajectory. Investors are advised to monitor employment data and other economic indicators closely, as they will likely shape the near-term outlook for the CAD.


    Canadian dollar to US dollar - CAD/USD Trend

     
    CAD to USD is at 14-day lows near 0.7181, 1.7% above its 3-month average of 0.7064, having traded in a quite stable 5.3% range from 0.6892 to 0.7258
    |
     
    1 CAD =
    0.7184We compare provider deals to this wholesale mid-market rate. Read more
    USD
     
    -0.6%
    14d-lows
     
    Track Rate

    View My Rate Tracker


    Compare & Save on Exchange Rates

    Exchange rates can vary significantly between banks and currency exchange providers, so it's important to compare rates from different sources before making a conversion.

    The below table makes it easy to calculate and compare the Total Cost you are being charged on currency rates and the possible savings of using a foreign exchange provider rather than your bank.


    Loading exchange rates...


    Top CAD Rates


    Canadian dollar to US dollar
    CADUSD 90 day chart

    CAD to USD is at 14-day lows near 0.7181, 1.7% above its 3-month average of 0.7064, having traded in a quite stable 5.3% range from 0.6892 to 0.7258
    CAD to USD
    0.7184
    -0.6%
    14d-lows

    US dollar to Canadian dollar
    USDCAD 90 day chart

    USD to CAD is at 14-day highs near 1.3926, 1.7% below its 3-month average of 1.416, having traded in a quite stable 5.3% range from 1.3777 to 1.4509
    USD to CAD
    1.3920
    +0.6%
    14d-highs

    Canadian dollar to Euro
    CADEUR 90 day chart

    CAD to EUR at 0.6397 is 1.3% below its 3-month average of 0.6482, having traded in a fairly volatile 8.1% range from 0.6275 to 0.6784
    CAD to EUR
    0.6399

    Canadian dollar to Mexican peso
    CADMXN 90 day chart

    CAD to MXN is at 30-day lows near 14.03, 1.4% below its 3-month average of 14.23, having traded in a quite stable 5.8% range from 13.85 to 14.66
    CAD to MXN
    14.03
    -1.0%
    30d-lows

    US dollar to Euro
    USDEUR 90 day chart

    USD to EUR is at 14-day highs near 0.8908, 3.0% below its 3-month average of 0.9181, having traded in a quite volatile 11.7% range from 0.8686 to 0.9702
    USD to EUR
    0.8907
    +0.7%
    14d-highs

    Canadian dollar to Indian rupee
    CADINR 90 day chart

    CAD to INR is at 14-day highs near 61.79, 1.5% above its 3-month average of 60.87, having traded in a quite stable 4.6% range from 59.37 to 62.08
    CAD to INR
    61.58
    +0.8%
    14d-highs

    Canadian dollar to British pound
    CADGBP 90 day chart

    CAD to GBP at 0.5425 is just 0.7% below its 3-month average of 0.5461, having traded in a quite stable 5.7% range from 0.5347 to 0.5651
    CAD to GBP
    0.5429
    -0.2%

    Canadian dollar to Philippine peso
    CADPHP 90 day chart

    CAD to PHP is at 30-day lows near 39.99, just 0.9% below its 3-month average of 40.37, having traded in a very stable 3.9% range from 39.71 to 41.25
    CAD to PHP
    39.92
    -0.3%
    30d-lows

    Canadian dollar to Australian dollar
    CADAUD 90 day chart

    CAD to AUD at 1.1232 is just above its 3-month average, having traded in a relatively stable 7.4% range from 1.0963 to 1.1770
    CAD to AUD
    1.1219
    -0.1%
    30d-lows

    Indian rupee to Canadian dollar
    INRCAD 90 day chart

    INR to CAD is at 14-day lows near 0.016183, 1.5% below its 3-month average of 0.016431, having traded in a quite stable 4.6% range from 0.016107 to 0.016843
    INR to CAD
    0.016238
    -0.8%
    14d-lows

    A-Z


    Canadian dollar to Australian dollar
    CADAUD 90 day chart

    CAD to AUD at 1.1232 is just above its 3-month average, having traded in a relatively stable 7.4% range from 1.0963 to 1.1770
    CAD to AUD
    1.1219
    -0.1%
    30d-lows

    Canadian dollar to Brazilian real
    CAD to BRL is at 7-day lows near 4.0657, near its 3-month average, having traded in a fairly volatile 9.2% range from 3.9430 to 4.3044
    CAD to BRL
    4.0678
    -2.1%

    Canadian dollar to Swiss franc
    CADCHF 90 day chart

    CAD to CHF at 0.5972 is 2.3% below its 3-month average of 0.6114, having traded in a fairly volatile 9.4% range from 0.5846 to 0.6393
    CAD to CHF
    0.5974
    +0.3%
    14d-highs

    Canadian dollar to Chilean peso
    CAD to CLP is at 7-day lows near 676.0, just 0.9% above its 3-month average of 670, having traded in a quite volatile 11.0% range from 640.4 to 710.7
    CAD to CLP
    676.29
    -1.1%

    Canadian dollar to Chinese yuan
    CADCNY 90 day chart

    CAD to CNY is at 14-day lows near 5.1883, just 1.0% above its 3-month average of 5.1386, having traded in a quite stable 5.7% range from 5.0079 to 5.2951
    CAD to CNY
    5.1907
    -0.6%
    14d-lows

    Canadian dollar to Czech Republic horuna
    CADCZK 90 day chart

    CAD to CZK at 15.94 is 1.8% below its 3-month average of 16.23, having traded in a fairly volatile 8.5% range from 15.70 to 17.04
    CAD to CZK
    15.95
    +0.2%

    Canadian dollar to Danish krone
    CADDKK 90 day chart

    CAD to DKK at 4.7725 is 1.3% below its 3-month average of 4.8378, having traded in a relatively stable 8.0% range from 4.6848 to 5.0611
    CAD to DKK
    4.7740
    +0.1%

    Canadian dollar to Euro
    CADEUR 90 day chart

    CAD to EUR at 0.6397 is 1.3% below its 3-month average of 0.6482, having traded in a fairly volatile 8.1% range from 0.6275 to 0.6784
    CAD to EUR
    0.6399

    Canadian dollar to British pound
    CADGBP 90 day chart

    CAD to GBP at 0.5425 is just 0.7% below its 3-month average of 0.5461, having traded in a quite stable 5.7% range from 0.5347 to 0.5651
    CAD to GBP
    0.5429
    -0.2%

    Canadian dollar to Hong Kong dollar
    CADHKD 90 day chart

    CAD to HKD is at 14-day lows near 5.5830, 1.7% above its 3-month average of 5.4889, having traded in a quite stable 5.0% range from 5.3606 to 5.6274
    CAD to HKD
    5.5855
    -0.5%
    14d-lows

    Canadian dollar to Israeli new sheqel
    CADILS 90 day chart

    CAD to ILS is at 30-day lows near 2.5710, near its 3-month average, having traded in a fairly volatile 9.5% range from 2.4761 to 2.7125
    CAD to ILS
    2.5722
    -0.8%
    30d-lows

    Canadian dollar to Indian rupee
    CADINR 90 day chart

    CAD to INR is at 14-day highs near 61.79, 1.5% above its 3-month average of 60.87, having traded in a quite stable 4.6% range from 59.37 to 62.08
    CAD to INR
    61.58
    +0.8%
    14d-highs

    Canadian dollar to Japanese yen
    CADJPY 90 day chart

    CAD to JPY at 104.8 is just 0.6% above its 3-month average of 104.2, having traded in a relatively stable 6.2% range from 101.8 to 108.1
    CAD to JPY
    104.52
    +0.9%

    Canadian dollar to Mexican peso
    CADMXN 90 day chart

    CAD to MXN is at 30-day lows near 14.03, 1.4% below its 3-month average of 14.23, having traded in a quite stable 5.8% range from 13.85 to 14.66
    CAD to MXN
    14.03
    -1.0%
    30d-lows

    Canadian dollar to Malaysian ringgit
    CADMYR 90 day chart

    CAD to MYR at 3.0740 is 1.3% below its 3-month average of 3.1144, having traded in a quite stable 5.0% range from 3.0417 to 3.1952
    CAD to MYR
    3.0978
    +0.3%

    Canadian dollar to New Zealand dollar
    CADNZD 90 day chart

    CAD to NZD at 1.2170 is just 0.5% below its 3-month average of 1.2232, having traded in a quite stable 5.5% range from 1.2003 to 1.2668
    CAD to NZD
    1.2186

    Canadian dollar to Philippine peso
    CADPHP 90 day chart

    CAD to PHP is at 30-day lows near 39.99, just 0.9% below its 3-month average of 40.37, having traded in a very stable 3.9% range from 39.71 to 41.25
    CAD to PHP
    39.92
    -0.3%
    30d-lows

    Canadian dollar to Pakistani rupee
    CADPKR 90 day chart

    CAD to PKR is at 7-day lows near 202.4, 2.3% above its 3-month average of 198, having traded in a relatively stable 6.1% range from 192.8 to 204.6
    CAD to PKR
    202.52
    -0.6%

    Canadian dollar to Singapore dollar
    CADSGD 90 day chart

    CAD to SGD at 0.9339 is just 0.6% below its 3-month average of 0.9393, having traded in a very stable 3.3% range from 0.9216 to 0.9519
    CAD to SGD
    0.9335
    -0.2%

    Canadian dollar to Thai baht
    CADTHB 90 day chart

    CAD to THB at 23.74 is just below its 3-month average, having traded in a quite stable 5.2% range from 23.26 to 24.46
    CAD to THB
    23.76
    -0.2%
    30d-lows

    Canadian dollar to New Taiwan dollar
    CADTWD 90 day chart

    CAD to TWD at 21.75 is 5.4% below its 3-month average of 22.99, having traded in a quite volatile 11.7% range from 21.11 to 23.59
    CAD to TWD
    21.66
    -1.0%

    Canadian dollar to US dollar
    CADUSD 90 day chart

    CAD to USD is at 14-day lows near 0.7181, 1.7% above its 3-month average of 0.7064, having traded in a quite stable 5.3% range from 0.6892 to 0.7258
    CAD to USD
    0.7184
    -0.6%
    14d-lows

    Canadian dollar to South African rand
    CADZAR 90 day chart

    CAD to ZAR at 13.09 is near its 3-month average, having traded in a quite volatile 10.1% range from 12.62 to 13.89
    CAD to ZAR
    13.12
    -0.8%