Switch .com Best Exchange Rates .com Best Exchange Rates .com Best Exchange Rates

    Euro Exchange Update, Chart & History

    EUR Markets Update - Our review of Euro Forecasts and News plus Charts and Historic Rates. Check EUR Trends over various time periods.


    Euro (EUR) Market Update
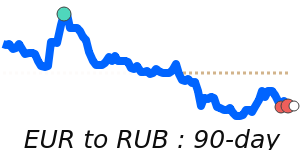
    The euro (EUR) continues to exhibit strength, recently trading near 14-day highs against the US dollar (USD) at approximately 1.1370, which represents a notable 3.0% premium over its 3-month average of 1.1037. This momentum has primarily stemmed from ongoing USD weakness, influenced by various macroeconomic factors. Analysts have pointed out that the negative correlation between the EUR and USD has played a significant role in bolstering the euro's performance, despite looming concerns about potential interest rate cuts from the European Central Bank (ECB) that may cap further gains.

    Additionally, today’s anticipated release of Eurozone Purchasing Managers’ Indices (PMIs) holds the potential for positive surprises, with economists forecasting an uptick in private sector growth. Such data could further enhance the euro's trajectory moving into the latter half of the week.

    Conversely, the EUR has struggled against the British pound (GBP), currently trading at 30-day lows around 0.8394, just 0.5% shy of its 3-month average. The stabilization of this pair, which has seen a confined trading range of approximately 5.3% over the past month, suggests a measured response to fluctuations in both currencies. Meanwhile, the euro is trading slightly above its 3-month average against the Japanese yen (JPY) at 162.1, maintaining a stable range as geopolitical tensions continue to influence investor sentiment.

    The broader geopolitical landscape remains a critical factor affecting the euro, particularly the ongoing war in Ukraine, which has generated significant economic uncertainty in the Eurozone. Experts note that the impact of sanctions on Russia and the resulting energy supply disruptions have led to fluctuations in the euro's stability. The current energy crisis continues to exert inflationary pressures, with the EU's response to these challenges being crucial for the euro's outlook.

    On the commodities front, oil prices are also impacting the euro’s performance. Currently, oil (OIL to USD) is trading at 64.78, which is 4.8% below its 3-month average, and has experienced a volatile range of 24.7% in recent trading sessions. Since the Eurozone is sensitive to oil price movements, shifts in crude oil markets can indirectly affect the strength of the euro.

    Looking ahead, analysts emphasize that the future direction of the euro hinges on ECB monetary policy decisions, ongoing inflation control, and overall political stability within the Eurozone. As the European economy navigates these challenges, these elements will remain pivotal in determining the euro’s performance in global markets.


    Euro to US dollar - EUR/USD Trend

     
    EUR to USD is at 14-day highs near 1.1370, 3.0% above its 3-month average of 1.1037, having traded in a quite volatile 11.0% range from 1.0375 to 1.1513
    |
     
    loading
    1 EUR =
    1.1370We compare provider deals to this wholesale mid-market rate. Read more
    USD
     
    +0.8%
    14d-highs
     
    Track Rate

    View My Rate Tracker

       
    Euro - 1 year change versus major currencies
     

    Compare & Save on Exchange Rates

    Exchange rates can vary significantly between banks and currency exchange providers, so it's important to compare rates from different sources before making a conversion.

    The below table makes it easy to calculate and compare the Total Cost you are being charged on currency rates and the possible savings of using a foreign exchange provider rather than your bank.


    Loading exchange rates...


    Top EUR Rates


    Euro to US dollar
    EURUSD 90 day chart

    EUR to USD is at 14-day highs near 1.1370, 3.0% above its 3-month average of 1.1037, having traded in a quite volatile 11.0% range from 1.0375 to 1.1513
    EUR to USD
    1.1370
    +0.8%
    14d-highs

    Euro to Canadian dollar
    EURCAD 90 day chart

    EUR to CAD at 1.5618 is just above its 3-month average, having traded in a relatively stable 7.0% range from 1.4890 to 1.5937
    EUR to CAD
    1.5618
    -0.1%
    14d-highs

    Euro to British pound
    EURGBP 90 day chart

    EUR to GBP is at 30-day lows near 0.8394, just 0.5% below its 3-month average of 0.8441, having traded in a quite stable 5.3% range from 0.8246 to 0.8683
    EUR to GBP
    0.8395
    -0.1%
    30d-lows

    Euro to Malaysian ringgit
    EURMYR 90 day chart

    EUR to MYR at 4.8106 is just 0.6% below its 3-month average of 4.8376, having traded in a fairly volatile 9.1% range from 4.6111 to 5.0307
    EUR to MYR
    4.8106
    -0.2%

    Euro to Australian dollar
    EURAUD 90 day chart

    EUR to AUD at 1.7503 is just above its 3-month average, having traded in a quite volatile 11.7% range from 1.6461 to 1.8395
    EUR to AUD
    1.7503
    -0.5%
    14d-highs

    Euro to United Arab Emirates dirham
    EURAED 90 day chart

    EUR to AED is at 14-day highs near 4.1761, 3.0% above its 3-month average of 4.0539, having traded in a quite volatile 11.0% range from 3.8104 to 4.2288
    EUR to AED
    4.1761
    +0.8%
    14d-highs

    Euro to Russian ruble
    EURRUB 90 day chart

    EUR to RUB at 90.36 is 2.4% below its 3-month average of 92.6, having traded in a fairly volatile 9.3% range from 89.31 to 97.62
    EUR to RUB
    90.36
    +0.5%

    Euro to New Zealand dollar
    EURNZD 90 day chart

    EUR to NZD at 1.8994 is near its 3-month average, having traded in a fairly volatile 8.7% range from 1.8220 to 1.9799
    EUR to NZD
    1.8994
    -0.7%
    14d-highs

    A-Z


    Euro to Australian dollar
    EURAUD 90 day chart

    EUR to AUD at 1.7503 is just above its 3-month average, having traded in a quite volatile 11.7% range from 1.6461 to 1.8395
    EUR to AUD
    1.7503
    -0.5%
    14d-highs

    Euro to Brazilian real
    EURBRL 90 day chart

    EUR to BRL at 6.4192 is 1.1% above its 3-month average of 6.3468, having traded in a quite volatile 11.5% range from 5.9956 to 6.6855
    EUR to BRL
    6.4192
    -0.3%
    14d-highs

    Euro to Canadian dollar
    EURCAD 90 day chart

    EUR to CAD at 1.5618 is just above its 3-month average, having traded in a relatively stable 7.0% range from 1.4890 to 1.5937
    EUR to CAD
    1.5618
    -0.1%
    14d-highs

    Euro to Swiss franc
    EURCHF 90 day chart

    EUR to CHF is at 14-day lows near 0.9332, just 0.9% below its 3-month average of 0.9422, having traded in a quite stable 4.7% range from 0.9227 to 0.9660
    EUR to CHF
    0.9340
    -0.2%
    14d-lows

    Euro to Chinese yuan
    EURCNY 90 day chart

    EUR to CNY is at 14-day highs near 8.1642, 1.9% above its 3-month average of 8.0143, having traded in a quite volatile 11.1% range from 7.5569 to 8.3959
    EUR to CNY
    8.1642
    +0.5%
    14d-highs

    Euro to Czech Republic horuna
    EURCZK 90 day chart

    EUR to CZK at 24.86 is just 0.6% below its 3-month average of 25, having traded in a stable 1.7% range from 24.84 to 25.26
    EUR to CZK
    24.86
    -0.1%

    Euro to Danish krone
    EURDKK 90 day chart

    EUR to DKK at 7.4644 is near its 3-month average, having traded in a stable 0.6% range from 7.4569 to 7.5010
    EUR to DKK
    7.4644
    +0.1%
    90d-lows

    Euro to British pound
    EURGBP 90 day chart

    EUR to GBP is at 30-day lows near 0.8394, just 0.5% below its 3-month average of 0.8441, having traded in a quite stable 5.3% range from 0.8246 to 0.8683
    EUR to GBP
    0.8395
    -0.1%
    30d-lows

    Euro to Hong Kong dollar
    EURHKD 90 day chart

    EUR to HKD is at 30-day highs near 8.9060, 3.8% above its 3-month average of 8.5823, having traded in a quite volatile 10.7% range from 8.0684 to 8.9335
    EUR to HKD
    8.9060
    +0.9%
    30d-highs

    Euro to Hungarian forint
    EUR to HUF is at 7-day highs near 404.0, near its 3-month average, having traded in a very stable 3.2% range from 397.6 to 410.2
    EUR to HUF
    403.93
    +0.2%

    Euro to Indonesian rupiah
    EURIDR 90 day chart

    EUR to IDR at 18472 is just 1.0% above its 3-month average of 18291, having traded in a rather volatile 13.6% range from 17048 to 19370
    EUR to IDR
    18,472
    +0.1%

    Euro to Israeli new sheqel
    EURILS 90 day chart

    EUR to ILS is at 14-day highs near 4.1059, 2.2% above its 3-month average of 4.0188, having traded in a rather volatile 14.7% range from 3.7209 to 4.2697
    EUR to ILS
    4.1059
    +1.2%
    14d-highs

    Euro to Indian rupee
    EURINR 90 day chart

    EUR to INR at 96.73 is 2.0% above its 3-month average of 94.79, having traded in a fairly volatile 8.3% range from 90.57 to 98.05
    EUR to INR
    96.73
    -0.3%
    14d-highs

    Euro to Japanese yen
    EURJPY 90 day chart

    EUR to JPY at 162.1 is just above its 3-month average, having traded in a quite stable 5.9% range from 155.8 to 165.0
    EUR to JPY
    162.08
    -0.2%
    14d-lows

    Euro to Mexican peso
    EURMXN 90 day chart

    EUR to MXN at 21.88 is just 0.7% below its 3-month average of 22.03, having traded in a fairly volatile 8.3% range from 21.32 to 23.08
    EUR to MXN
    21.88
    +0.4%

    Euro to Malaysian ringgit
    EURMYR 90 day chart

    EUR to MYR at 4.8106 is just 0.6% below its 3-month average of 4.8376, having traded in a fairly volatile 9.1% range from 4.6111 to 5.0307
    EUR to MYR
    4.8106
    -0.2%

    Euro to Norwegian krone
    EURNOK 90 day chart

    EUR to NOK is at 30-day lows near 11.49, 1.7% below its 3-month average of 11.69, having traded in a relatively stable 7.2% range from 11.30 to 12.11
    EUR to NOK
    11.49
    -0.2%
    30d-lows

    Euro to New Zealand dollar
    EURNZD 90 day chart

    EUR to NZD at 1.8994 is near its 3-month average, having traded in a fairly volatile 8.7% range from 1.8220 to 1.9799
    EUR to NZD
    1.8994
    -0.7%
    14d-highs

    Euro to Omani rial
    EUR to OMR is at 14-day highs near 0.4377, 3.0% above its 3-month average of 0.4248, having traded in a quite volatile 10.5% range from 0.3994 to 0.4413
    EUR to OMR
    0.4377
    +0.8%
    14d-highs

    Euro to Philippine peso
    EURPHP 90 day chart

    EUR to PHP at 62.93 is just above its 3-month average, having traded in a fairly volatile 8.4% range from 60.13 to 65.18
    EUR to PHP
    62.93
    +0.1%
    14d-highs

    Euro to Pakistani rupee
    EURPKR 90 day chart

    EUR to PKR is at 14-day highs near 320.6, 3.5% above its 3-month average of 309.8, having traded in a quite volatile 11.3% range from 290.0 to 322.9
    EUR to PKR
    320.57
    +0.9%
    14d-highs

    Euro to Polish zloty
    EURPLN 90 day chart

    EUR to PLN at 4.2606 is just 0.8% above its 3-month average of 4.2259, having traded in a relatively stable 6.6% range from 4.0273 to 4.2946
    EUR to PLN
    4.2606
    +0.2%

    Euro to Qatari rial
    EUR to QAR is at 14-day highs near 4.1454, 3.1% above its 3-month average of 4.0211, having traded in a quite volatile 11.0% range from 3.7770 to 4.1920
    EUR to QAR
    4.1454
    +0.7%
    14d-highs

    Euro to Russian ruble
    EURRUB 90 day chart

    EUR to RUB at 90.36 is 2.4% below its 3-month average of 92.6, having traded in a fairly volatile 9.3% range from 89.31 to 97.62
    EUR to RUB
    90.36
    +0.5%

    Euro to Saudi riyal
    EURSAR 90 day chart

    EUR to SAR is at 14-day highs near 4.2645, 3.0% above its 3-month average of 4.1399, having traded in a quite volatile 10.5% range from 3.8912 to 4.3016
    EUR to SAR
    4.2645
    +0.8%
    14d-highs

    Euro to Swedish krona
    EURSEK 90 day chart

    EUR to SEK at 10.84 is 1.2% below its 3-month average of 10.97, having traded in a very stable 4.0% range from 10.76 to 11.19
    EUR to SEK
    10.84
    -0.3%
    30d-lows

    Euro to Singapore dollar
    EURSGD 90 day chart

    EUR to SGD is at 14-day highs near 1.4635, just above its 3-month average, having traded in a relatively stable 7.5% range from 1.3966 to 1.5018
    EUR to SGD
    1.4635
    +0.4%
    14d-highs

    Euro to Thai baht
    EURTHB 90 day chart

    EUR to THB at 37.12 is just above its 3-month average, having traded in a fairly volatile 9.0% range from 35.07 to 38.23
    EUR to THB
    36.94
    +0.3%

    Euro to Turkish lira
    EURTRY 90 day chart

    EUR to TRY is at 90-day highs near 44.22, 5.8% above its 3-month average of 41.77, having traded in a very volatile 17.0% range from 37.78 to 44.22
    EUR to TRY
    44.21
    +0.7%
    90d-highs

    Euro to New Taiwan dollar
    EUR to TWD is at 14-day highs near 34.09, 3.9% below its 3-month average of 35.46, having traded in a rather volatile 13.2% range from 33.02 to 37.37
    EUR to TWD
    34.09
    +0.6%
    14d-highs

    Euro to US dollar
    EURUSD 90 day chart

    EUR to USD is at 14-day highs near 1.1370, 3.0% above its 3-month average of 1.1037, having traded in a quite volatile 11.0% range from 1.0375 to 1.1513
    EUR to USD
    1.1370
    +0.8%
    14d-highs

    Euro to Vietnamese dong
    EUR to VND is at 14-day highs near 29509, 3.8% above its 3-month average of 28441, having traded in a rather volatile 12.4% range from 26499 to 29797
    EUR to VND
    29,509
    +0.7%
    14d-highs

    Euro to Samoan tala
    EUR to WST is at 14-day highs near 3.1835, 3.0% above its 3-month average of 3.0904, having traded in a quite volatile 11.0% range from 2.9050 to 3.2237
    EUR to WST
    3.1835
    +0.8%
    14d-highs

    Euro to Central African franc
    EUR to XAF is steady at its 3-month average 656.
    EUR to XAF
    655.96

    Euro to East Caribbean dollar
    EUR to XCD is at 14-day highs near 3.0727, 3.0% above its 3-month average of 2.9821, having traded in a quite volatile 10.9% range from 2.8039 to 3.1086
    EUR to XCD
    3.0727
    +0.8%
    14d-highs

    Euro to West African franc
    EURXOF 90 day chart

    EUR to XOF is steady at its 3-month average 656.
    EUR to XOF
    655.96

    Euro to CFP franc
    EUR to XPF is steady at its 3-month average 119.3.
    EUR to XPF
    119.33

    Euro to South African rand
    EURZAR 90 day chart

    EUR to ZAR at 20.29 is just 0.5% below its 3-month average of 20.39, having traded in a rather volatile 13.3% range from 19.20 to 21.75
    EUR to ZAR
    20.29
    -0.1%