
Latest market analysis
EUR Market Update
03 Aug 2026 • 00:26 GMT
The euro is currently near 30-day highs against the US dollar at around 1.155, but overall remains within a relatively narrow 3.8% range from 1.136 to 1.179 over recent months. Traders are watching the upcoming US Fed meeting, as market expectations of a potential rate hike support the dollar's strength. While the euro has shown some resilience, factors like weak eurozone growth, rising energy costs, and geopolitical tensions in the Middle East continue to pressure its outlook.
Most major banks predict the euro might face challenges later this year, with some forecasting a slight decline toward 1.15 against the dollar if the Fed hints at further rate increases. Conversely, others see the pair holding around current levels or potentially rising if the Fed stays dovish.
Against other currencies, the euro is steady near recent averages—just below its 3-month trend against the British pound, and close to its long-term average versus the Australian dollar. Overall, the euro's position remains relatively stable, but caution is advised as global economic and geopolitical developments develop.
Forecast snapshot
Quick EUR/USD forecast
Near-term bias🔴 Mild downside
Expected range1.1550 – 1.1790
Dominant driver🏦 Central bank policy divergence
3-month trend🟢 Uptrend
Stay informed
EUR news & insights
Recent analysis, guides and market developments relevant to the euro.


Rate direction
Euro to US dollar · EUR/USD trend
Review the recent market direction, current mid-market rate and significant movement alerts.
Compare before you exchange
Compare and save on EUR exchange rates
Exchange rates vary between banks and currency providers. Use the comparison below to understand total costs and potential savings against typical bank pricing.
Loading exchange rates...
|
|
|
||
|
|
|
||
|
|
|
||
|
|
|
Explore EUR pairs
Popular EUR exchange rates
Open a currency pair to view its live rate, comparison options, recent trend and market context.
1 EUR =1.1530USD

1D+0.1%▲
1 EUR =1.6180CAD

1D−0.1%▼
1 EUR =0.8561GBP

1D0.0%⬦
1 EUR =4.7180MYR

1D+0.1%▲
1 EUR =1.6398AUD
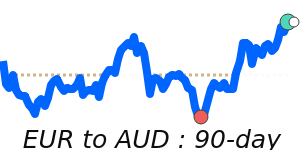
1D−0.4%▼
1 EUR =4.2342AED
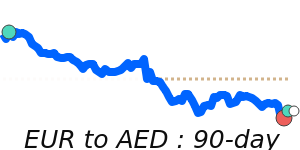
1D+0.1%▲
1 EUR =0.9329CHF
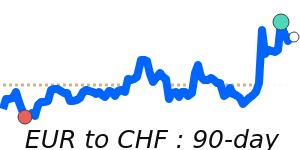
1D0.0%⬦
1 EUR =1.4777SGD
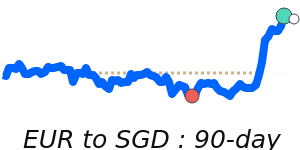
1D−0.1%▼