Latest market analysis
CAD Market Update
27 Jul 2026 • 00:27 GMT
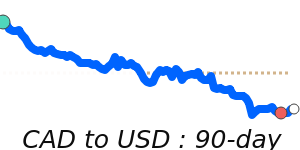
The Canadian dollar (CAD) remains close to its recent levels against the US dollar, trading around 0.7099. This is about 1% below its three-month average of 0.7171, and the pair has held within a stable range from 0.7026 to 0.7363. Recent soft inflation data in Canada, which showed June CPI slowing to 2.8%, has lessened expectations for further rate hikes by the Bank of Canada and pushed the USD/CAD higher, approaching 1.4060.
Meanwhile, the US dollar continues to experience mixed signals amid geopolitical tensions and energy market concerns, supported briefly by rising oil prices. The dollar's strength has helped keep the CAD under pressure, especially as US economic and policy developments unfold.
Looking ahead, if US dollar momentum persists, the CAD could stay pressured. Oil prices and US Federal Reserve decisions remain key factors. Some banks forecast a gradual decline in USD/CAD towards 1.34 by year's end, suggesting some potential for Canadian dollar recovery if the US dollar weakens or oil prices stay high. For now, the CAD remains relatively stable but sensitive to shifts in US dollar strength and global energy markets.
Forecast snapshot
Quick CAD/USD forecast
Near-term bias⚪ Range-bound
Expected range0.7060 – 0.7280
Dominant driver⚖️ Interest-rate differentials
3-month trend⚪ Range-bound
Stay informed
CAD news & insights
Recent analysis, guides and market developments relevant to the Canadian dollar.


Rate direction
Canadian dollar to US dollar · CAD/USD trend
Review the recent market direction, current mid-market rate and significant movement alerts.
Compare before you exchange
Compare and save on CAD exchange rates
Exchange rates vary between banks and currency providers. Use the comparison below to understand total costs and potential savings against typical bank pricing.
Loading exchange rates...
|
|
|
||
|
|
|
||
|
|
|
||
|
|
|
Explore CAD pairs
Popular CAD exchange rates
Open a currency pair to view its live rate, comparison options, recent trend and market context.
1 CAD =0.7103USD
1d+0.1%▲
1 CAD =0.6227EUR
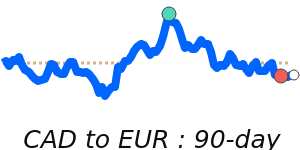
1d0.0%⬦
1 CAD =12.38MXN
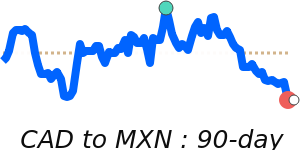
1d−0.2%▼
1 USD =0.8766EUR

1d−0.2%▼
1 CAD =68.33INR
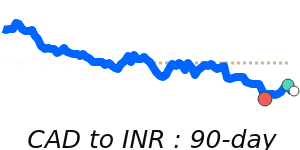
1d+0.3%▲
1 CAD =0.5318GBP
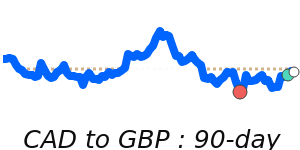
1d−0.1%▼
1 CAD =43.86PHP
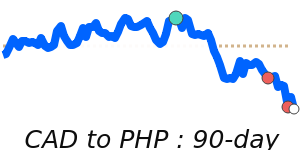
1d+0.1%▲
1 CAD =1.0149AUD

1d−0.1%▼
1 INR =0.014636CAD
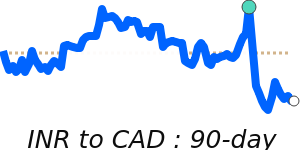
1d−0.3%▼