CAD Market Update
21 Jul 2026 • 00:28 GMT
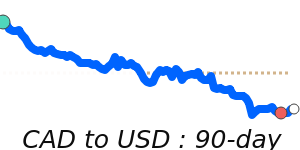
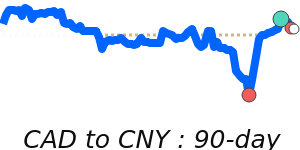
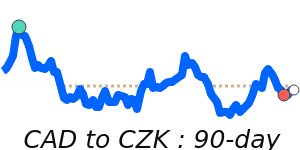
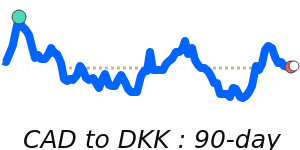
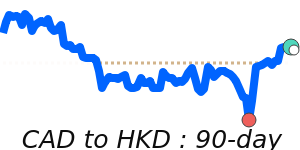
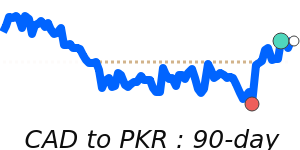
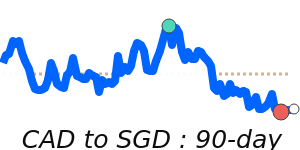
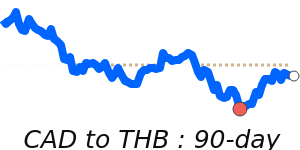
The Canadian dollar (CAD) remains under some pressure against the US dollar, trading at about 0.7106. This is roughly 1.1% below its three-month average of 0.7186, reflecting ongoing challenges from U.S. monetary policy and trade uncertainties. Despite higher oil prices providing some support, the wide interest rate gap favoring the U.S. dollar continues to weigh on the CAD.
Looking ahead, markets are watching the Bank of Canada's stance and U.S. inflation data closely. The bank's decision to hold rates at 2.25% suggests cautious optimism but offers limited immediate support for the CAD. Meanwhile, the U.S. dollar remains strong amid inflation worries and geopolitical tensions, which supports its safe-haven appeal.
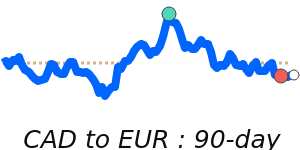
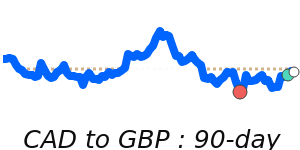
The CAD has also seen little movement against the euro and the yen, staying within stable ranges. Against the pound, the CAD is slightly weaker, trading below its average. Overall, while some modest gains could occur if oil prices stay supported and U.S. policy stabilizes, the dollar's strength remains a significant factor shaping the CAD’s recent performance.
📊 Quick forecast view
🔴 Mild downside
N/A
🏦 Central bank policy divergence
🔴 Downtrend