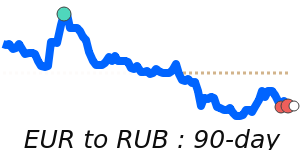
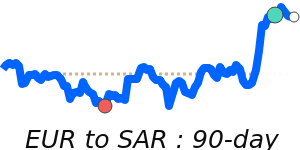
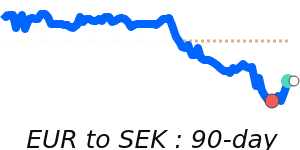
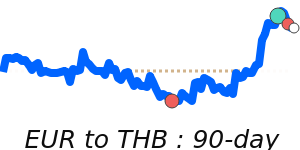
The euro (EUR) has encountered challenges recently, primarily driven by uncertainty surrounding the ongoing negotiations of the EU-US trade deal. Analysts have observed divisions within the EU regarding the terms of this agreement, which has contributed to downward pressure on the euro. Compounding this situation, retail sales in the Eurozone reported their most significant decline in almost two years in May, further denting investor confidence.
Inflation rates within the Eurozone remain elevated, a factor that impacts European Central Bank (ECB) monetary policy decisions. Recent comments from ECB officials suggest a potential pause in interest rate hikes, leading to speculation about the currency's stability moving forward. Additionally, GDP growth figures reflect signs of sluggishness, raising concerns about the overall economic health of the Eurozone.
Geopolitical tensions, especially in relation to trade with the US and the UK, continue to influence sentiment around the euro, as does the volatility in energy prices that has been observed due to global supply concerns. The ongoing war in Ukraine has brought about significant repercussions for the euro, with sanctions on Russia and energy supply disruptions introducing further uncertainty into the Eurozone economy.
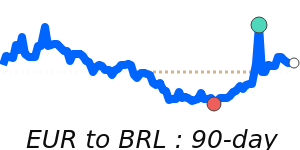
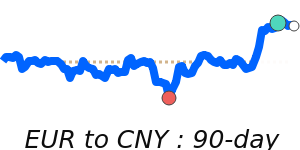
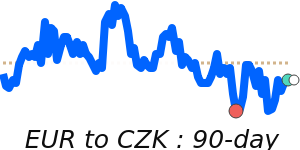
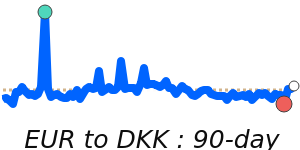
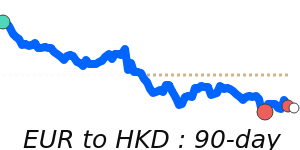
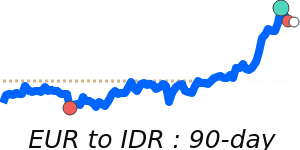
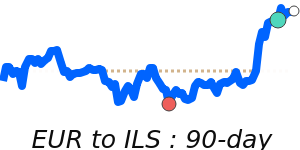
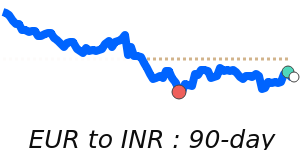
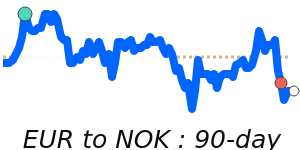
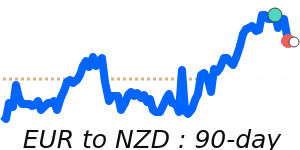
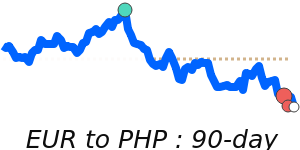
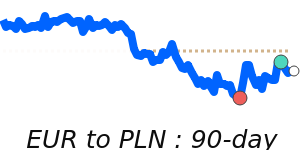
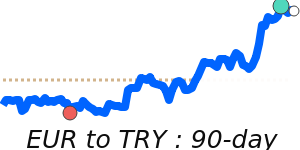
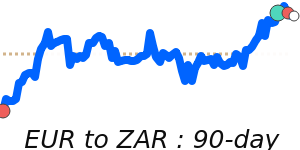
Market indicators show that EUR/USD is currently trading at 1.1701, marking a 14-day low yet still 2.3% above its three-month average of 1.1439. The EUR/GBP pair at 0.8619 is 1.3% above its average, while EUR/JPY at 171.2 sits 3.7% higher than its three-month average. These figures reflect a relatively stable trading range for these pairs, but they also highlight the euro's sensitivity to both macroeconomic trends and geopolitical developments.
Furthermore, the recent trends in oil prices are noteworthy, with WTI Crude priced at 68.64—a 2.5% increase from its three-month average—trading in a highly volatile range. Fluctuations in oil prices often impact the euro, given the Eurozone's reliance on energy imports.
Looking ahead, the euro's performance will depend significantly on ECB monetary policy, inflationary pressures, and the economic recovery of major member states. With Bulgaria poised to join the Eurozone in 2026, broader geopolitical stability will be crucial in shaping the euro's future trajectory in international markets.