Switch .com Best Exchange Rates .com Best Exchange Rates .com Best Exchange Rates
BER

Japanese yen Markets

JPY Currency Update - Our review of Japanese yen forecasts and news plus charts and historic rates. Check JPY Trends over various time periods.


The Japanese yen (JPY) remains a focal point in the currency markets, primarily influenced by escalating trade tensions and the Bank of Japan's (BoJ) monetary policies. Recently, the US imposed a 24% tariff on Japanese goods, heightening the impact of the trade war initiated during the Trump administration. This geopolitical backdrop has contributed to a flight to safety, strengthening the yen and the Swiss franc as investors seek refuge amid uncertainty.

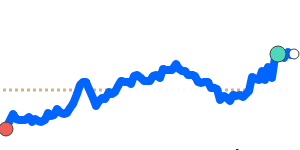
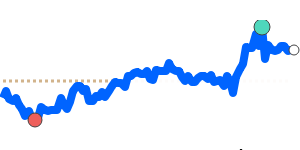
Analysts from MUFG Research have projected a USD/JPY exchange rate of 154.00 for Q1 2025, with expectations of a gradual drop to 148.00 by Q4 2025. However, due to recent depreciation against the dollar, a reassessment of these forecasts may be warranted. The yen often acts as a safe-haven asset, gaining traction during periods of global economic distress, but its recent performance showcases the complex interplay of external pressures.

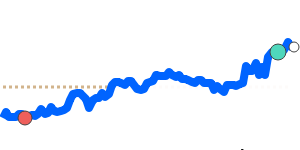
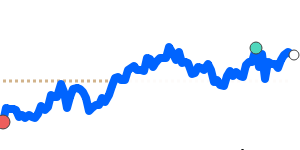
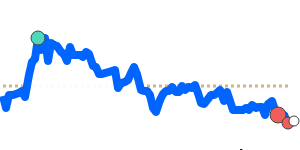
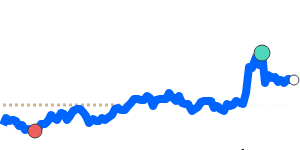
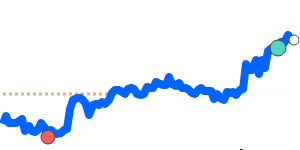
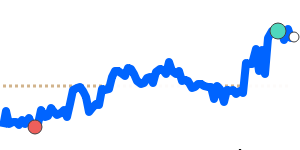
The JPY/USD pair is currently trading at 14-day highs near 0.006958, which is just 0.5% above its three-month average of 0.00692. This stability has seen it trading within a six percent range from 0.006684 to 0.007099. On the other hand, the JPY/EUR exchange rate at 0.005902 is 3.2% below its three-month average, indicating some weakening against the Euro. Similarly, the JPY/GBP rate at 0.005066 stands 2.2% below its three-month average, reflecting a consistent trend of underperformance against the British pound.

The yen's value is intricately linked to Japan's export-driven economy. A weaker yen typically boosts exports by making Japanese goods more competitive globally, while a stronger yen can have the opposite effect. Economic stability in trading partners like the US and China, along with the BoJ's interest rate policies, will continue to shape the outlook for the yen.

As global risk sentiment fluctuates due to geopolitical events, such as the ongoing situation in Ukraine, the yen’s safe-haven role may be further tested. Rising commodity prices and supply chain disruptions pose additional risks to the currency's performance. Overall, market participants should stay alert to changes in BoJ policy and broader global economic developments that could heavily influence the future trajectory of the yen.


US dollar to Japanese yen - USD/JPY Trend

 
USD to JPY is at 14-day lows near 143.7, just 0.6% below its 3-month average of 144.5, having traded in a relatively stable 6.2% range from 140.9 to 149.6
|
 
1 USD =
143.55We compare provider deals to this wholesale mid-market rate. Read more
JPY
 
-0.4%
14d-lows
 
Track Rate

View My Rate Tracker


Compare & Save on Exchange Rates

Exchange rates can vary significantly between banks and currency exchange providers, so it's important to compare rates from different sources before making a conversion.

The below table makes it easy to calculate and compare the Total Cost you are being charged on currency rates and the possible savings of using a foreign exchange provider rather than your bank.


Loading exchange rates...


Top JPY Rates


Japanese yen to US dollar
JPYUSD 90 day chart

JPY to USD is at 14-day highs near 0.006958, just 0.5% above its 3-month average of 0.00692, having traded in a relatively stable 6.2% range from 0.006684 to 0.007099
JPY to USD
0.006966
+0.4%
14d-highs

Japanese yen to Euro
JPY to EUR at 0.005902 is 3.2% below its 3-month average of 0.006096, having traded in a relatively stable 7.1% range from 0.005889 to 0.006306
JPY to EUR
0.005906
-0.2%
90d-lows

Japanese yen to Canadian dollar
JPYCAD 90 day chart

JPY to CAD at 0.009467 is 1.1% below its 3-month average of 0.009572, having traded in a quite stable 4.8% range from 0.009375 to 0.009827
JPY to CAD
0.009479
-0.2%

Japanese yen to British pound
JPYGBP 90 day chart

JPY to GBP at 0.005066 is 2.2% below its 3-month average of 0.00518, having traded in a relatively stable 6.3% range from 0.005038 to 0.005355
JPY to GBP
0.005070
+0.2%

Japanese yen to Indian rupee
JPYINR 90 day chart

JPY to INR is at 14-day highs near 0.5964, just 0.7% above its 3-month average of 0.5923, having traded in a quite stable 5.7% range from 0.5720 to 0.6046
JPY to INR
0.5965
+0.7%
14d-highs

Japanese yen to Australian dollar
JPYAUD 90 day chart

JPY to AUD at 0.010580 is 2.0% below its 3-month average of 0.010795, having traded in a fairly volatile 9.5% range from 0.010478 to 0.011476
JPY to AUD
0.010599
-0.2%

Japanese yen to Singapore dollar
JPY to SGD is at 7-day highs near 0.008843, 1.7% below its 3-month average of 0.008995, having traded in a quite stable 5.4% range from 0.008787 to 0.009261
JPY to SGD
0.008851

Japanese yen to Chinese yuan
JPYCNY 90 day chart

JPY to CNY is at 14-day highs near 0.049850, just below its 3-month average, having traded in a relatively stable 6.7% range from 0.048518 to 0.051769
JPY to CNY
0.049908
+0.3%
14d-highs

A-Z


Japanese yen to Australian dollar
JPYAUD 90 day chart

JPY to AUD at 0.010580 is 2.0% below its 3-month average of 0.010795, having traded in a fairly volatile 9.5% range from 0.010478 to 0.011476
JPY to AUD
0.010599
-0.2%

Japanese yen to Canadian dollar
JPYCAD 90 day chart

JPY to CAD at 0.009467 is 1.1% below its 3-month average of 0.009572, having traded in a quite stable 4.8% range from 0.009375 to 0.009827
JPY to CAD
0.009479
-0.2%

Japanese yen to Chinese yuan
JPYCNY 90 day chart

JPY to CNY is at 14-day highs near 0.049850, just below its 3-month average, having traded in a relatively stable 6.7% range from 0.048518 to 0.051769
JPY to CNY
0.049908
+0.3%
14d-highs

Japanese yen to Hong Kong dollar
JPY to HKD is at 14-day highs near 0.054622, 1.1% above its 3-month average of 0.054019, having traded in a quite stable 5.9% range from 0.052007 to 0.055083
JPY to HKD
0.054686
+0.4%
14d-highs

Japanese yen to Indian rupee
JPYINR 90 day chart

JPY to INR is at 14-day highs near 0.5964, just 0.7% above its 3-month average of 0.5923, having traded in a quite stable 5.7% range from 0.5720 to 0.6046
JPY to INR
0.5965
+0.7%
14d-highs

Japanese yen to Philippine peso
JPYPHP 90 day chart

JPY to PHP at 0.3919 is just 0.7% above its 3-month average of 0.3893, having traded in a relatively stable 6.7% range from 0.3765 to 0.4019
JPY to PHP
0.3918

Japanese yen to Singapore dollar
JPY to SGD is at 7-day highs near 0.008843, 1.7% below its 3-month average of 0.008995, having traded in a quite stable 5.4% range from 0.008787 to 0.009261
JPY to SGD
0.008851

Japanese yen to Thai baht
JPYTHB 90 day chart

JPY to THB at 0.2257 is 1.4% below its 3-month average of 0.229, having traded in a relatively stable 6.4% range from 0.2241 to 0.2385
JPY to THB
0.2259
-0.1%
14d-highs

Japanese yen to US dollar
JPYUSD 90 day chart

JPY to USD is at 14-day highs near 0.006958, just 0.5% above its 3-month average of 0.00692, having traded in a relatively stable 6.2% range from 0.006684 to 0.007099
JPY to USD
0.006966
+0.4%
14d-highs