JPY Market Update
23 Jul 2026 • 00:27 GMT
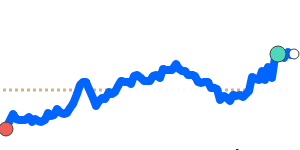
The Japanese yen remains under pressure against the US dollar, trading above 163 for the first time in nearly four decades. Although Japan’s recent intervention efforts and a modest rate hike to 1.00% provided some support, they haven't been enough to stop the yen’s slide. The broad strength of the dollar, driven by safe-haven demand amid geopolitical tensions and higher energy prices, continues to weigh on the yen.
Currently, USD/JPY is about 1.8% above its 3-month average, indicating a significant move. Traders should keep an eye on support levels around 162.20 and resistance near 164.40, as these could influence short-term moves. The yen’s weakness is also reflected in other pairings, such as EUR/JPY, which is near its recent 30-day lows, and GBP/JPY, trading close to its 7-day highs.
Looking ahead, any change in Japanese government intervention or shifts in U.S. monetary policy could further impact the yen’s outlook. For now, the yen remains fragile amid the broader dollar strength environment.
📊 Quick forecast view
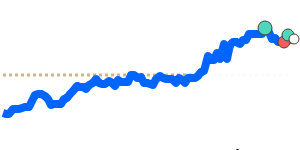
🟢 Mild upside
163.1000 – 166.0560
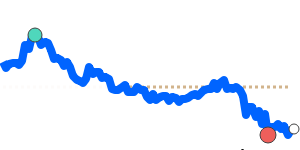
🌍 Global risk sentiment
🔴 Downtrend