Switch .com Best Exchange Rates .com Best Exchange Rates .com Best Exchange Rates
BER

Mexican peso Markets

MXN Currency Update - Our review of Mexican peso forecasts and news plus charts and historic rates. Check MXN Trends over various time periods.


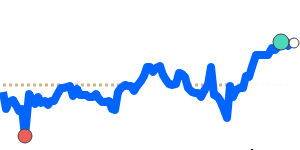
The Mexican peso (MXN) has experienced notable volatility in recent weeks as traders reacted to evolving US trade policies. Analysts observed a decline in the peso against the US dollar following comments from President Claudia Sheinbaum regarding potential retaliatory measures against the US after newly implemented tariffs. This dip pushed the MXN to 7-day lows near 0.053570, which is approximately 3.0% above its 3-month average of 0.05202.

However, the currency showed resilience and rebounded when US Commerce Secretary Howard Lutnick indicated that the current tariffs may not be permanent. The situation has sparked hopes of negotiations between Mexico and the US, leading to a rally in risk-sensitive currencies. Notably, Trump agreed to temporarily delay the 25% tariffs on Mexico for one month, in exchange for Mexico deploying 10,000 troops to the border to combat fentanyl trafficking and manage migration.

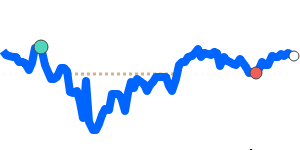
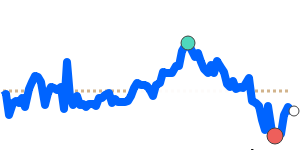
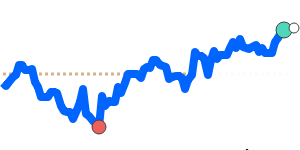
In conjunction with this news, the MXN has displayed some stability against other currencies. The exchange rate for MXN to EUR stands at 0.045865, just 0.9% above its 3-month average of 0.045435, reflecting a steady trading range. The MXN to GBP is currently at 0.039702, which is 2.7% above the 3-month average, while the MXN to JPY rate has seen a more pronounced increase, trading at 7.8880—4.9% above its average.

Overall, the peso is trading within a relatively stable range, signaling that while market participants remain cautious, there is optimism towards a more favorable trade environment. Analysts recommend closely monitoring further developments in US-Mexico relations as they will likely play a significant role in shaping the peso's trajectory in the weeks ahead.


US dollar to Mexican peso - USD/MXN Trend

 
USD to MXN at 18.66 is 3.0% below its 3-month average of 19.23, having traded in a relatively stable 8.0% range from 18.61 to 20.10
|
 
1 USD =
18.73We compare provider deals to this wholesale mid-market rate. Read more
MXN
 
+0.1%
 
Track Rate

View My Rate Tracker


Compare & Save on Exchange Rates

Exchange rates can vary significantly between banks and currency exchange providers, so it's important to compare rates from different sources before making a conversion.

The below table makes it easy to calculate and compare the Total Cost you are being charged on currency rates and the possible savings of using a foreign exchange provider rather than your bank.


Loading exchange rates...


Top MXN Rates


Mexican peso to US dollar
MXNUSD 90 day chart

MXN to USD is at 7-day lows near 0.053570, 3.0% above its 3-month average of 0.05202, having traded in a relatively stable 8.0% range from 0.049744 to 0.053748
MXN to USD
0.053399
-0.1%

Mexican peso to Euro
MXNEUR 90 day chart

MXN to EUR at 0.045865 is just 0.9% above its 3-month average of 0.045435, having traded in a quite stable 5.2% range from 0.043869 to 0.046168
MXN to EUR
0.045777
-0.1%

Mexican peso to Canadian dollar
MXNCAD 90 day chart

MXN to CAD at 0.073337 is 2.4% above its 3-month average of 0.071611, having traded in a relatively stable 6.4% range from 0.069090 to 0.073511
MXN to CAD
0.073164
-0.2%
90d-highs

Mexican peso to British pound
MXN to GBP at 0.039702 is 2.7% above its 3-month average of 0.038671, having traded in a quite stable 5.8% range from 0.037593 to 0.039764
MXN to GBP
0.039753
-0.1%
90d-highs

Mexican peso to Indian rupee
MXNINR 90 day chart

MXN to INR is at 7-day lows near 4.5991, 3.3% above its 3-month average of 4.4514, having traded in a relatively stable 8.0% range from 4.2643 to 4.6075
MXN to INR
4.5905
-0.1%

Mexican peso to Japanese yen
MXN to JPY at 7.8880 is 4.9% above its 3-month average of 7.5172, having traded in a quite volatile 11.0% range from 7.1204 to 7.9072
MXN to JPY
7.8886
-0.2%
90d-highs

Mexican peso to Australian dollar
MXN to AUD is at 7-day lows near 0.081480, 1.3% above its 3-month average of 0.080427, having traded in a quite stable 5.4% range from 0.078294 to 0.082532
MXN to AUD
0.081526
-0.1%

Mexican peso to Singapore dollar
MXN to SGD at 0.068605 is 2.1% above its 3-month average of 0.067176, having traded in a quite stable 5.0% range from 0.065502 to 0.068784
MXN to SGD
0.068463
-0.1%

Mexican peso to Chinese yuan
MXNCNY 90 day chart

MXN to CNY is at 7-day lows near 0.3841, 2.4% above its 3-month average of 0.3752, having traded in a quite stable 6.0% range from 0.3639 to 0.3857
MXN to CNY
0.3828
-0.1%

A-Z


Mexican peso to Canadian dollar
MXNCAD 90 day chart

MXN to CAD at 0.073337 is 2.4% above its 3-month average of 0.071611, having traded in a relatively stable 6.4% range from 0.069090 to 0.073511
MXN to CAD
0.073164
-0.2%
90d-highs

Mexican peso to US dollar
MXNUSD 90 day chart

MXN to USD is at 7-day lows near 0.053570, 3.0% above its 3-month average of 0.05202, having traded in a relatively stable 8.0% range from 0.049744 to 0.053748
MXN to USD
0.053399
-0.1%