Latest market analysis
MXN Market Update
30 Jul 2026 • 00:32 GMT
The Mexican Peso remains relatively stable against the US dollar, trading just below its 3-month average at around 0.057326 USD per MXN. Over the past week, it has held within a narrow range, between 0.056800 and 0.058231, reflecting subdued volatility. Recent support has come from Banxico's decision to keep interest rates steady, which helps maintain the peso's carry trade appeal. Meanwhile, positive risk sentiment related to easing geopolitical tensions, including improvements in Iran-US relations, has also supported the peso.
Looking ahead, the US dollar has shown resilience amid geopolitical uncertainties and rising energy prices, which could influence the USD/MXN exchange rate. Analysts expect some variability, with forecasts ranging from 17.82 to 18.50 by the end of 2026, depending on US monetary policy actions and Mexican rate decisions.
Overall, the peso’s performance remains steady in a quiet trading environment, but developments in global risk appetite and economic policies could bring short-term fluctuations. For now, traders can expect the MXN to stay within its current range as markets closely monitor upcoming US and Mexican economic data.
Forecast snapshot
Quick MXN/USD forecast
Near-term bias🔴 Mild downside
Expected range0.0570 – 0.0580
Dominant driver🌍 Global risk sentiment
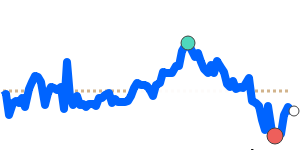
3-month trend🔴 Downtrend
Stay informed
MXN news & insights
Recent analysis, guides and market developments relevant to the Mexican peso.


Rate direction
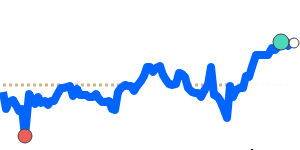
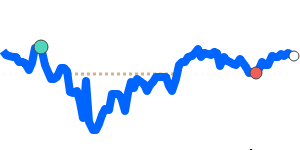
US dollar to Mexican peso · USD/MXN trend
Review the recent market direction, current mid-market rate and significant movement alerts.
Compare before you exchange
Compare and save on MXN exchange rates
Exchange rates vary between banks and currency providers. Use the comparison below to understand total costs and potential savings against typical bank pricing.
Loading exchange rates...
|
|
|
||
|
|
|
||
|
|
|
||
|
|
|
Explore MXN pairs
Popular MXN exchange rates
Open a currency pair to view its live rate, comparison options, recent trend and market context.
1 MXN =0.057660USD
1D−0.1%▼
1 MXN =0.050010EUR
1D−0.8%▼
1 MXN =0.080736CAD
1D−0.6%▼
1 MXN =0.042811GBP
1D−0.6%▼
1 MXN =5.5030INR
1D+0.1%▲
1 MXN =9.1939JPY
1D−0.4%▼
90dHighs
1 MXN =0.082046AUD
1D+0.1%▲
1 MXN =0.073916SGD
1D−0.4%▼
1 MXN =0.3901CNY
1D−0.1%▼