Switch .com Best Exchange Rates .com Best Exchange Rates .com Best Exchange Rates
BER

Mexican peso Markets

MXN Currency Update - Our review of Mexican peso forecasts and news plus charts and historic rates. Check MXN Trends over various time periods.


The Mexican peso (MXN) has experienced significant volatility recently, primarily influenced by ongoing trade tensions with the United States. The peso initially weakened against the US dollar following President Claudia Sheinbaum's announcement of potential retaliatory measures in response to tariffs reintroduced by the Trump administration. However, it subsequently rebounded when US Commerce Secretary Howard Lutnick indicated that Trump might consider easing these tariffs, fueling optimism for negotiations between the two nations.

Recent developments show that Trump agreed to delay the imposition of the planned 25% tariffs on Mexico for an additional month after discussions with Sheinbaum. In exchange, Mexico committed to deploying 10,000 troops to its border, aimed at curbing the migration of fentanyl and other migrants into the US. This concession appears to have reassured traders, allowing the peso to lead gains among risk-sensitive currencies.

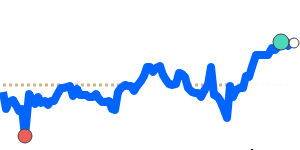
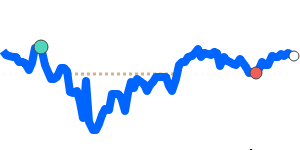
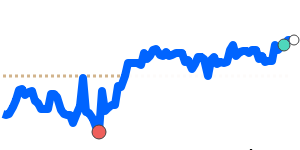
Currently, the MXN to USD exchange rate has reached 90-day highs near 0.053756, representing a 3.6% increase above its three-month average of 0.051881. The peso has fluctuated within a notable 9.3% range during this period, trading between 0.049188 and 0.053756. In relation to the euro, the MXN is at 14-day highs around 0.045937, exceeding its three-month average of 0.045356 by 1.3%. The trading range for this pair has been relatively stable at 6.5%, between 0.043332 and 0.046168.

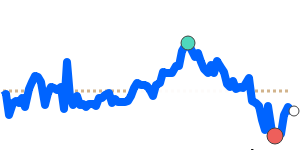
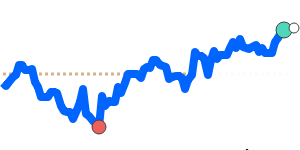
against the British pound, the MXN has also reached 90-day highs near 0.039584, 2.5% above its three-month average of 0.0386, with a more consistent trading range of 5.3% from 0.037593 to 0.039584. Additionally, the MXN to JPY exchange rate currently sits at 7.8640, marking a significant 5.0% rise over the three-month average of 7.4898, although this pair has demonstrated a volatile 11.6% range, from 7.0581 to 7.8781.

Overall, analysts suggest that while the peso encounters short-term fluctuations tied to trade negotiations, a longer-term stabilization may occur if the tariff situation resolves favorably. This evolving landscape provides opportunities for individuals and businesses engaging in international transactions who may benefit from closely monitoring these currency trends.


US dollar to Mexican peso - USD/MXN Trend

 
USD to MXN is at 90-day lows near 18.60, 3.5% below its 3-month average of 19.28, having traded in a fairly volatile 9.3% range from 18.60 to 20.33
|
 
1 USD =
18.65We compare provider deals to this wholesale mid-market rate. Read more
MXN
 
-0.2%
90d-lows
 
Track Rate

View My Rate Tracker


Compare & Save on Exchange Rates

Exchange rates can vary significantly between banks and currency exchange providers, so it's important to compare rates from different sources before making a conversion.

The below table makes it easy to calculate and compare the Total Cost you are being charged on currency rates and the possible savings of using a foreign exchange provider rather than your bank.


Loading exchange rates...


Top MXN Rates


Mexican peso to US dollar
MXNUSD 90 day chart

MXN to USD is at 90-day highs near 0.053756, 3.6% above its 3-month average of 0.051881, having traded in a fairly volatile 9.3% range from 0.049188 to 0.053756
MXN to USD
0.053609
+0.2%
90d-highs

Mexican peso to Euro
MXNEUR 90 day chart

MXN to EUR is at 14-day highs near 0.045937, 1.3% above its 3-month average of 0.045356, having traded in a relatively stable 6.5% range from 0.043332 to 0.046168
MXN to EUR
0.045916
+0.3%
14d-highs

Mexican peso to Canadian dollar
MXNCAD 90 day chart

MXN to CAD at 0.073399 is 2.7% above its 3-month average of 0.071443, having traded in a relatively stable 7.7% range from 0.068202 to 0.073451
MXN to CAD
0.073439
-0.1%
90d-highs

Mexican peso to British pound
MXN to GBP is at 90-day highs near 0.039584, 2.5% above its 3-month average of 0.0386, having traded in a quite stable 5.3% range from 0.037593 to 0.039584
MXN to GBP
0.039539
+0.2%
90d-highs

Mexican peso to Indian rupee
MXNINR 90 day chart

MXN to INR is at 90-day highs near 4.6087, 3.8% above its 3-month average of 4.4396, having traded in a fairly volatile 8.9% range from 4.2337 to 4.6087
MXN to INR
4.5948
+0.2%
90d-highs

Mexican peso to Japanese yen
MXN to JPY at 7.8640 is 5.0% above its 3-month average of 7.4898, having traded in a quite volatile 11.6% range from 7.0581 to 7.8781
MXN to JPY
7.8787
+0.1%
90d-highs

Mexican peso to Australian dollar
MXN to AUD is at 7-day lows near 0.081531, 1.5% above its 3-month average of 0.080319, having traded in a quite stable 5.7% range from 0.078079 to 0.082532
MXN to AUD
0.081441
-0.7%

Mexican peso to Singapore dollar
MXN to SGD is at 90-day highs near 0.068784, 2.5% above its 3-month average of 0.067057, having traded in a quite stable 6.0% range from 0.064904 to 0.068784
MXN to SGD
0.068687
+0.1%
90d-highs

Mexican peso to Chinese yuan
MXNCNY 90 day chart

MXN to CNY is at 90-day highs near 0.3857, 3.0% above its 3-month average of 0.3744, having traded in a relatively stable 7.5% range from 0.3587 to 0.3857
MXN to CNY
0.3845
+0.1%
90d-highs

A-Z


Mexican peso to Canadian dollar
MXNCAD 90 day chart

MXN to CAD at 0.073399 is 2.7% above its 3-month average of 0.071443, having traded in a relatively stable 7.7% range from 0.068202 to 0.073451
MXN to CAD
0.073439
-0.1%
90d-highs

Mexican peso to US dollar
MXNUSD 90 day chart

MXN to USD is at 90-day highs near 0.053756, 3.6% above its 3-month average of 0.051881, having traded in a fairly volatile 9.3% range from 0.049188 to 0.053756
MXN to USD
0.053609
+0.2%
90d-highs