Switch .com Best Exchange Rates .com Best Exchange Rates .com Best Exchange Rates
BER

Norwegian krone Markets

NOK Currency Update - Our review of Norwegian krone forecasts and news plus charts and historic rates. Check NOK Trends over various time periods.


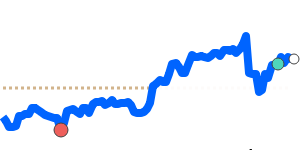
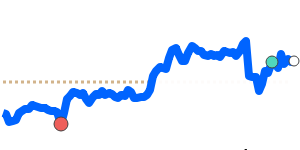
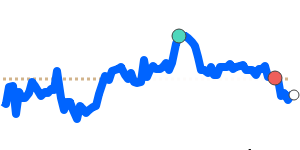
The USD to NOK exchange rate has recently shown increased volatility, influenced by various economic indicators and market sentiments. Currently, the rate hovers near 10.05, which is 2.3% lower than its three-month average of 10.29. Analysts note that the pair has experienced a significant trading range, fluctuating 10.9% from 9.90 to 10.98 over the last few months.

Recent U.S. economic data, particularly the non-farm payroll figures, have bolstered the USD. The addition of 147,000 jobs in June, surpassing forecasts, along with a decrease in the unemployment rate and stronger ISM services PMI, has contributed to the U.S. dollar's strength. These factors indicate resilience in the U.S. economy, which is likely to support the USD against currencies like the NOK.

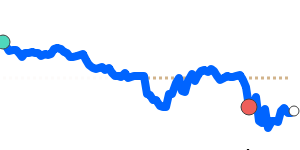
On the other hand, the Norwegian krone has gained approximately 9% year-to-date against the USD, driven by improving European economic sentiment and an inflation surprise in Norway. The Norges Bank remains cautious, with only slight easing expected, which has kept NOK in a strong position. However, some analysts suggest that the EUR/NOK pair could see a rebound in the second quarter, as European sentiment may face hurdles related to U.S. tariffs.

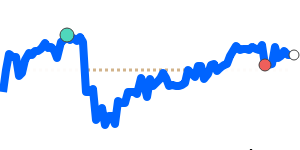
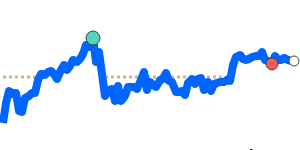
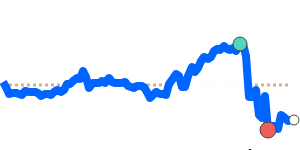
Oil prices, a crucial factor for the NOK, are trading at $68.80, reflecting a 3.2% increase from the three-month average of $66.66, and have shown a considerable volatility of 31.1%, ranging from $60.14 to $78.85. Given Norway's status as a major oil exporter, continued fluctuations in oil prices will likely impact the strength of the NOK against the USD.

Overall, while the USD has strengthened following positive U.S. labor market data, the NOK remains robust, underpinned by favorable domestic conditions and rising oil prices. The interplay of these factors suggests a complex landscape for the USD/NOK exchange rate in the near future, with potential for further volatility as global economic conditions evolve.


US dollar to Norwegian krone - USD/NOK Trend

 
USD to NOK is at 7-day lows near 10.05, 2.3% below its 3-month average of 10.29, having traded in a quite volatile 10.9% range from 9.90 to 10.98
|
 
1 USD =
10.09We compare provider deals to this wholesale mid-market rate. Read more
NOK
 
-0.1%
 
Track Rate

View My Rate Tracker


Compare & Save on Exchange Rates

Exchange rates can vary significantly between banks and currency exchange providers, so it's important to compare rates from different sources before making a conversion.

The below table makes it easy to calculate and compare the Total Cost you are being charged on currency rates and the possible savings of using a foreign exchange provider rather than your bank.


Loading exchange rates...


Top NOK Rates


Norwegian krone to US dollar
NOKUSD 90 day chart

NOK to USD is at 7-day highs near 0.099490, 2.3% above its 3-month average of 0.097236, having traded in a quite volatile 10.9% range from 0.091038 to 0.1010
NOK to USD
0.099143
+0.1%

Norwegian krone to Euro
NOKEUR 90 day chart

NOK to EUR at 0.084532 is 1.0% below its 3-month average of 0.085425, having traded in a relatively stable 6.1% range from 0.082554 to 0.087613
NOK to EUR
0.084172
+0.3%

Norwegian krone to Canadian dollar
NOKCAD 90 day chart

NOK to CAD is at 30-day lows near 0.1350, just 0.5% above its 3-month average of 0.1343, having traded in a relatively stable 6.4% range from 0.1293 to 0.1376
NOK to CAD
0.1350
-0.1%
30d-lows

Norwegian krone to British pound
NOKGBP 90 day chart

NOK to GBP at 0.072804 is just above its 3-month average, having traded in a quite stable 5.4% range from 0.071037 to 0.074904
NOK to GBP
0.072603
-0.1%

Norwegian krone to Indian rupee
NOKINR 90 day chart

NOK to INR at 8.4969 is 2.1% above its 3-month average of 8.3212, having traded in a quite volatile 11.1% range from 7.8291 to 8.7006
NOK to INR
8.5067
-0.1%

Norwegian krone to Japanese yen
NOKJPY 90 day chart

NOK to JPY at 14.40 is 2.6% above its 3-month average of 14.04, having traded in a fairly volatile 9.4% range from 13.35 to 14.61
NOK to JPY
14.32
+0.8%

Norwegian krone to Australian dollar
NOKAUD 90 day chart

NOK to AUD at 0.1512 is near its 3-month average, having traded in a quite stable 5.1% range from 0.1481 to 0.1556
NOK to AUD
0.1513
+0.1%

Norwegian krone to Singapore dollar
NOKSGD 90 day chart

NOK to SGD is at 7-day highs near 0.1268, just 0.6% above its 3-month average of 0.1261, having traded in a quite stable 5.3% range from 0.1230 to 0.1295
NOK to SGD
0.1262
+0.2%

Norwegian krone to Chinese yuan
NOKCNY 90 day chart

NOK to CNY is at 7-day highs near 0.7129, 1.4% above its 3-month average of 0.7028, having traded in a fairly volatile 8.9% range from 0.6656 to 0.7251
NOK to CNY
0.7104
+0.1%

A-Z


Norwegian krone to Danish krone
NOKDKK 90 day chart

NOK to DKK at 0.6307 is 1.1% below its 3-month average of 0.6374, having traded in a relatively stable 6.1% range from 0.6158 to 0.6534
NOK to DKK
0.6280
+0.3%

Norwegian krone to Euro
NOKEUR 90 day chart

NOK to EUR at 0.084532 is 1.0% below its 3-month average of 0.085425, having traded in a relatively stable 6.1% range from 0.082554 to 0.087613
NOK to EUR
0.084172
+0.3%

Norwegian krone to British pound
NOKGBP 90 day chart

NOK to GBP at 0.072804 is just above its 3-month average, having traded in a quite stable 5.4% range from 0.071037 to 0.074904
NOK to GBP
0.072603
-0.1%

Norwegian krone to Indian rupee
NOKINR 90 day chart

NOK to INR at 8.4969 is 2.1% above its 3-month average of 8.3212, having traded in a quite volatile 11.1% range from 7.8291 to 8.7006
NOK to INR
8.5067
-0.1%

Norwegian krone to Swedish krona
NOKSEK 90 day chart

NOK to SEK at 0.9520 is 1.5% above its 3-month average of 0.9383, having traded in a relatively stable 6.2% range from 0.9106 to 0.9669
NOK to SEK
0.9479
+0.7%

Norwegian krone to US dollar
NOKUSD 90 day chart

NOK to USD is at 7-day highs near 0.099490, 2.3% above its 3-month average of 0.097236, having traded in a quite volatile 10.9% range from 0.091038 to 0.1010
NOK to USD
0.099143
+0.1%