Latest market analysis
NOK Market Update
31 Jul 2026 • 00:29 GMT
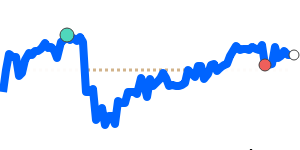
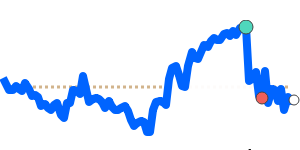
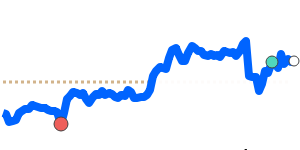
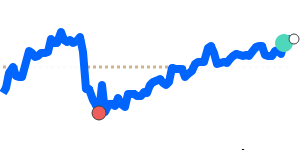
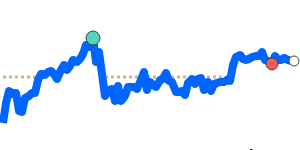
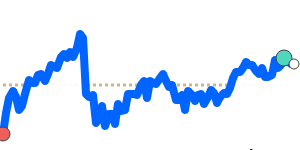
The Norwegian krone (NOK) has been relatively stable against most major currencies recently. It is trading near its 3-month average against the euro at around 0.0910, showing little recent volatility. Against the US dollar, the NOK reached a 30-day high near 0.1049, close to its 3-month average, after trading within an 8.2% range from 0.1007 to 0.1090. This suggests some recent strength, supported by ongoing monetary policy expectations.
The key driver for the NOK remains Norges Bank’s potential interest rate hikes, which could support the currency further if implemented in August or September. The US dollar has also been influenced by geopolitical tensions and energy prices, but remains supported by stable growth and inflation expectations. Overall, the NOK’s position against major currencies is steady, with notable strength against the dollar and euro due to geopolitical and monetary policy influences. Keep an eye on Norges Bank’s upcoming decisions and US economic data for further clues on NOK movements.
Forecast snapshot
Quick NOK/USD forecast
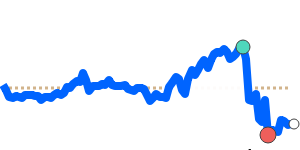
Near-term bias🔴 Mild downside
Expected range0.1040 – 0.1090
Dominant driver🌍 Global risk sentiment
3-month trend🔴 Downtrend
Stay informed
NOK news & insights
Recent analysis, guides and market developments relevant to the Norwegian krone.


Rate direction
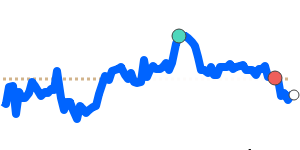
US dollar to Norwegian krone · USD/NOK trend
Review the recent market direction, current mid-market rate and significant movement alerts.
Compare before you exchange
Compare and save on NOK exchange rates
Exchange rates vary between banks and currency providers. Use the comparison below to understand total costs and potential savings against typical bank pricing.
Loading exchange rates...
|
|
|
||
|
|
|
||
|
|
|
||
|
|
|
Explore NOK pairs
Popular NOK exchange rates
Open a currency pair to view its live rate, comparison options, recent trend and market context.
1 NOK =0.1049USD
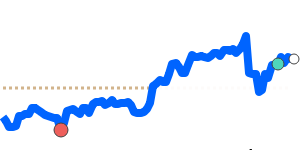
1D+0.6%▲
1 NOK =0.091065EUR
1D+0.1%▲
1 NOK =0.1470CAD
1D+0.3%▲
1 NOK =0.077957GBP
1D−0.1%▼
1 NOK =10.04INR
1D+0.6%▲
1 NOK =16.84JPY
1D−1.4%▼
1 NOK =0.1492AUD
1D−0.4%▼
1 NOK =0.1346SGD
1D+0.1%▲
1 NOK =0.7086CNY
1D+0.4%▲