Switch .com Best Exchange Rates .com Best Exchange Rates .com Best Exchange Rates
BER

Thai baht Markets

THB Currency Update - Our review of Thai baht forecasts and news plus charts and historic rates. Check THB Trends over various time periods.


The Thai baht (THB) is facing significant pressure as recent developments in the global trade landscape have fueled uncertainty in emerging Asian currencies. Following the imposition of a 36% reciprocal tariff rate by the US on Thai goods, concerns have escalated regarding the potential for a broader trade war under President Trump's administration. This sentiment has contributed to a decline in risk appetite across the region, prompting a drop in several Asian currencies, including the baht, which has slid approximately 2% alongside the South Korean won.

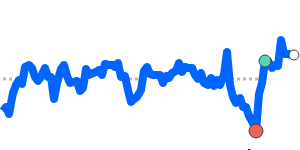
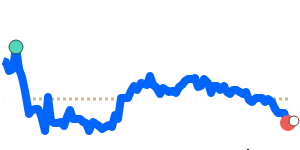
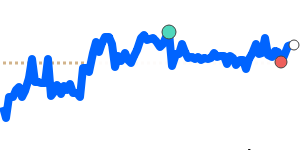
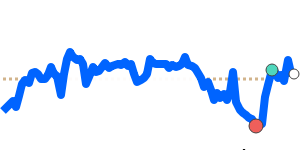
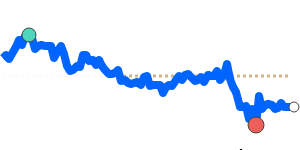
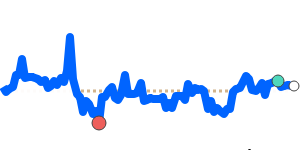
Price data indicates that the THB to USD exchange rate stands at 0.030836, which is 1.8% above its three-month average of 0.030285. The trading range for the THB against the dollar has remained relatively stable, fluctuating between 0.028663 and 0.030930 over the past three months. Conversely, the THB to EUR has dipped to 0.026202, now 1.5% below its three-month average of 0.026609, with a tighter trading range observed between 0.026099 and 0.027107. For THB to GBP, the rate is currently at 0.022566, just below its three-month average, maintaining a narrow range from 0.022275 to 0.022917.

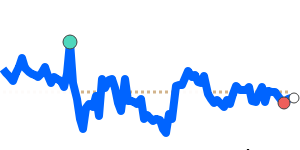
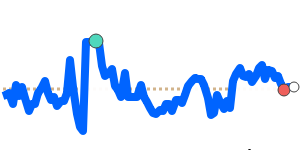
The THB to JPY has shown some resilience, trading at 4.4619, which is 2.0% above its three-month average of 4.3729. This currency pair has traded within a relatively stable range of 4.1930 to 4.4665, indicating some degree of strength against the yen amidst the turbulent backdrop of trade tensions.

Overall, experts project ongoing volatility for the Thai baht, influenced by external factors such as global trade developments and regional monetary policy adjustments. With central banks in Asia, including Thailand, increasingly considering interest rate cuts to support growth, market participants should brace for continued fluctuations in THB exchange rates.


US dollar to Thai baht - USD/THB Trend

 
USD to THB at 32.42 is 1.8% below its 3-month average of 33.03, having traded in a relatively stable 7.9% range from 32.33 to 34.89
|
 
1 USD =
32.30We compare provider deals to this wholesale mid-market rate. Read more
THB
 
+0.3%
90d-lows
 
Track Rate

View My Rate Tracker


Compare & Save on Exchange Rates

Exchange rates can vary significantly between banks and currency exchange providers, so it's important to compare rates from different sources before making a conversion.

The below table makes it easy to calculate and compare the Total Cost you are being charged on currency rates and the possible savings of using a foreign exchange provider rather than your bank.


Loading exchange rates...


Top THB Rates


Thai baht to US dollar
THBUSD 90 day chart

THB to USD at 0.030836 is 1.8% above its 3-month average of 0.030285, having traded in a relatively stable 7.9% range from 0.028663 to 0.030930
THB to USD
0.030960
-0.3%
90d-highs

Thai baht to Euro
THBEUR 90 day chart

THB to EUR at 0.026202 is 1.5% below its 3-month average of 0.026609, having traded in a very stable 3.9% range from 0.026099 to 0.027107
THB to EUR
0.026285

Thai baht to Canadian dollar
THBCAD 90 day chart

THB to CAD is at 7-day lows near 0.041858, near its 3-month average, having traded in a very stable 3.7% range from 0.040881 to 0.042380
THB to CAD
0.042145
-0.4%

Thai baht to British pound
THBGBP 90 day chart

THB to GBP at 0.022566 is just below its 3-month average, having traded in a very stable 2.9% range from 0.022275 to 0.022917
THB to GBP
0.022672
-0.5%

Thai baht to Indian rupee
THBINR 90 day chart

THB to INR at 2.6335 is 1.6% above its 3-month average of 2.5917, having traded in a relatively stable 7.5% range from 2.4740 to 2.6593
THB to INR
2.6564
-0.5%
14d-highs

Thai baht to Japanese yen
THBJPY 90 day chart

THB to JPY at 4.4619 is 2.0% above its 3-month average of 4.3729, having traded in a relatively stable 6.5% range from 4.1930 to 4.4665
THB to JPY
4.4729
+0.4%

Thai baht to Australian dollar
THBAUD 90 day chart

THB to AUD at 0.046879 is just 0.6% below its 3-month average of 0.047163, having traded in a very stable 3.5% range from 0.046534 to 0.048160
THB to AUD
0.047239
-0.2%

Thai baht to Singapore dollar
THBSGD 90 day chart

THB to SGD at 0.039292 is near its 3-month average, having traded in a very stable 2.2% range from 0.038795 to 0.039630
THB to SGD
0.039425
-0.2%
14d-highs

Thai baht to Chinese yuan
THBCNY 90 day chart

THB to CNY at 0.2210 is just 1.0% above its 3-month average of 0.2189, having traded in a relatively stable 6.3% range from 0.2103 to 0.2235
THB to CNY
0.2218
-0.3%
14d-highs