
Latest market analysis
THB Market Update
01 Aug 2026 • 01:11 GMT
The Thai baht remains relatively steady against major currencies but is trading slightly weaker compared to its recent averages. Against the US dollar, the baht is at about 0.02982, roughly 1.6% below its three-month average, indicating some softening despite a recent stable range. The outlook remains influenced by global factors, such as a stronger US dollar ahead of the upcoming Federal Reserve meeting, which could keep pressure on emerging market currencies including the baht.
Domestically, recent Thai measures to control gold transactions and a slowed economy suggest cautious sentiment. The Bank of Thailand’s rate cut in December 2025 and a modest economic growth forecast support a cautious view for the baht’s outlook, although political stability following February’s elections has helped bolster investor confidence.
While the baht's decline is modest, external factors like global energy prices and Fed policy signals could impact its direction. Major institutions forecast the baht might weaken toward 32 against the USD later this year, amid ongoing global uncertainties. Overall, the baht remains stable but is sensitive to both domestic policy shifts and global economic developments.
Stay informed
THB news & insights
Recent analysis, guides and market developments relevant to the Thai baht.

Rate direction
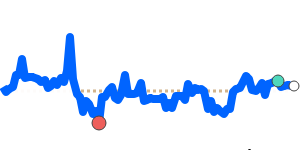
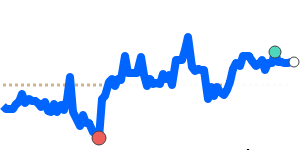
US dollar to Thai baht · USD/THB trend
Review the recent market direction, current mid-market rate and significant movement alerts.
Compare before you exchange
Compare and save on THB exchange rates
Exchange rates vary between banks and currency providers. Use the comparison below to understand total costs and potential savings against typical bank pricing.
Loading exchange rates...
|
|
|
||
|
|
|
||
|
|
|
||
|
|
|
Explore THB pairs
Popular THB exchange rates
Open a currency pair to view its live rate, comparison options, recent trend and market context.
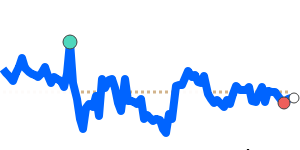
1 THB =0.029816USD
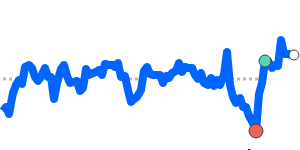
1D−0.3%▼
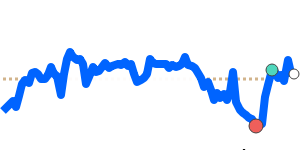
1 THB =0.025845EUR
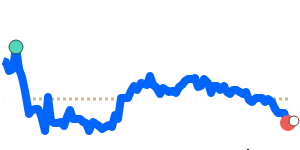
1D−0.4%▼
90dLows
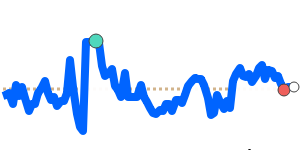
1 THB =0.041837CAD
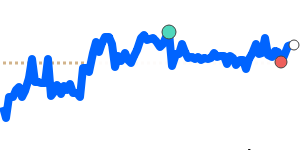
1D−0.2%▼
1 THB =0.022115GBP
1D−0.5%▼
1 THB =2.8445INR
1D−0.5%▼
1 THB =4.6941JPY
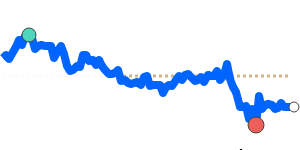
1D−1.6%▼
90dLows
1 THB =0.042510AUD
1D−0.1%▼
1 THB =0.038281SGD
1D−0.1%▼
1 THB =0.2013CNY
1D−0.4%▼