Switch .com Best Exchange Rates .com Best Exchange Rates .com Best Exchange Rates
BER

Africa - Key Exchange Rates

Latest mid-market exchange rates with 90-day UP/DOWN trends and HIGH/LOW alerts for the most popular African cross rates. Keep track of when currency rates are in your favour.

Stay informed with the latest exchange rates for key African currencies, including the South African Rand (ZAR), Nigerian Naira (NGN), Egyptian Pound (EGP), and others. Whether you're conducting business, planning travel, or monitoring economic trends across the continent, our up-to-date information provides a comprehensive view of currency values throughout Africa. Access real-time data and insights to make informed decisions for your currency exchange needs across the diverse economies of Africa.

Africa


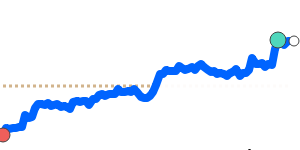
United Arab Emirates dirham to Indian rupee
AEDINR 90 day chart

AED to INR is at 14-day highs near 24.52, just 0.9% above its 3-month average of 24.28, having traded in a very stable 3.6% range from 23.89 to 24.75
AED to INR
24.51
1d0.0%
14dHighs

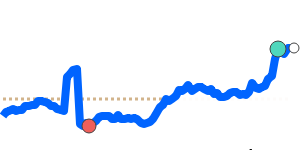
Euro to Ghanaian cedi
EURGHS 90 day chart

EUR to GHS is at 90-day lows near 12.27, 6.0% below its 3-month average of 13.05, having traded in a very volatile 20.2% range from 12.27 to 14.75
EUR to GHS
12.27
1d−0.1%
90dLows

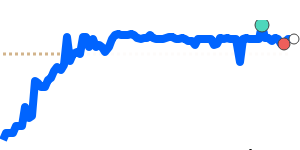
Euro to Moroccan dirham
EUR to MAD at 10.71 is near its 3-month average, having traded in a very stable 2.1% range from 10.60 to 10.82
EUR to MAD
10.71
1d−0.1%
 

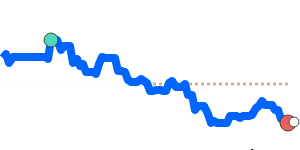
Euro to Nigerian naira
EURNGN 90 day chart

EUR to NGN at 1686 is just below its 3-month average, having traded in a very stable 3.9% range from 1656 to 1721
EUR to NGN
1,685.6
1d−0.1%
 

US dollar to Ghanaian cedi
USDGHS 90 day chart

USD to GHS at 10.48 is 6.5% below its 3-month average of 11.21, having traded in a very volatile 20.3% range from 10.47 to 12.60
USD to GHS
10.48
1d+0.1%
90dLows

US dollar to Libyan dinar
USD to LYD is at 7-day highs near 5.4202, just below its 3-month average, having traded in a stable 1.2% range from 5.4115 to 5.4750
USD to LYD
5.4202
1d+0.2%
 

US dollar to Moroccan dirham
USDMAD 90 day chart

USD to MAD is at 7-day highs near 9.1532, just 0.6% below its 3-month average of 9.2094, having traded in a very stable 2.2% range from 9.1159 to 9.3137
USD to MAD
9.1532
1d+0.2%
 

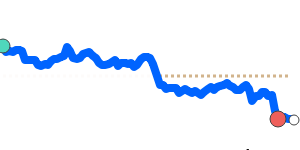
US dollar to Nigerian naira
USDNGN 90 day chart

USD to NGN at 1440 is just 0.8% below its 3-month average of 1452, having traded in a very stable 3.1% range from 1434 to 1478
USD to NGN
1,440.5
1d+0.1%
90dLows

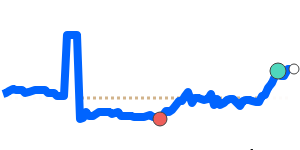
US dollar to Central African franc
USDXAF 90 day chart

USD to XAF is at 14-day highs near 560.4, just 0.6% below its 3-month average of 563.5, having traded in a very stable 2.7% range from 556.4 to 571.4
USD to XAF
560.56
1d+0.2%
14dHighs

US dollar to West African franc
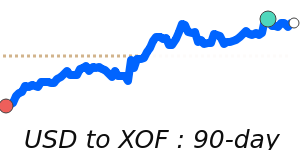
USDXOF 90 day chart

USD to XOF is at 14-day highs near 560.4, just 0.6% below its 3-month average of 563.5, having traded in a very stable 2.7% range from 556.4 to 571.4
USD to XOF
560.56
1d+0.2%
14dHighs

US dollar to South African rand
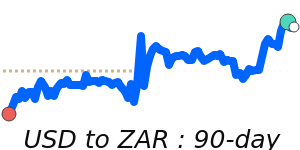
USDZAR 90 day chart

USD to ZAR at 16.50 is 3.3% below its 3-month average of 17.07, having traded in a relatively stable 6.4% range from 16.49 to 17.54
USD to ZAR
16.50
1d+0.1%
90dLows

View a full list of exchange rates by selecting your Base (from) currency: