
Latest market analysis
JPY Market Update
03 Aug 2026 • 00:26 GMT
The Japanese yen remains under pressure against major currencies, with USD/JPY trading around 157.6, about 1.7% below its three-month average of 160.4. Despite efforts by Japanese authorities to curb yen declines, intervention has so far provided only temporary relief. The yen's weakness is driven by the wide interest rate gap between the US and Japan, coupled with ongoing expectations that the Bank of Japan will keep rates steady for now.
Market traders are closely watching US dollar strength, which has regained momentum ahead of the upcoming FOMC meeting, with expectations of possible rate hikes supporting the dollar. Meanwhile, the yen’s decline persists, with a notable increase of 1.8% relative to its average against the USD over the last three months.
Long-term forecasts remain mixed: some banks suggest the USD/JPY could rise further, toward 164 by year's end, while others see a potential drop to around 158. Overall, the yen’s position will likely continue to hinge on US monetary policy decisions and Japanese intervention measures, amid ongoing global economic uncertainties.
Forecast snapshot
Quick USD/JPY forecast
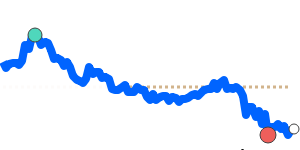
Near-term bias🔴 Mild downside
Expected range157.6000 – 163.9000
Dominant driver🌍 Global risk sentiment
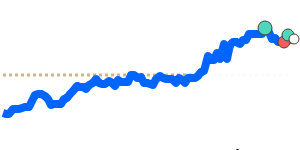
3-month trend🟢 Uptrend
Stay informed
JPY news & insights
Recent analysis, guides and market developments relevant to the Japanese yen.


Rate direction
US dollar to Japanese yen · USD/JPY trend
Review the recent market direction, current mid-market rate and significant movement alerts.
Compare before you exchange
Compare and save on JPY exchange rates
Exchange rates vary between banks and currency providers. Use the comparison below to understand total costs and potential savings against typical bank pricing.
Loading exchange rates...
|
|
|
||
|
|
|
||
|
|
|
||
|
|
|
Explore JPY pairs
Popular JPY exchange rates
Open a currency pair to view its live rate, comparison options, recent trend and market context.
1 JPY =0.006375USD
1D−0.1%▼
1 USD =156.88JPY

1D+0.1%▲
1 JPY =0.008954CAD
1D−0.2%▼
90dHighs
1 JPY =0.005538EUR
1D−0.2%▼
1 JPY =0.004748GBP
1D−0.1%▼
1 AED =42.71JPY
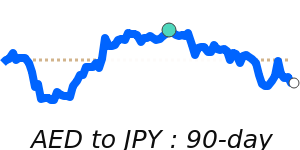
1D+0.1%▲
1 JPY =114.65IDR
1D0.0%⬦
1 MYR =38.30JPY
1D+0.1%▲
1 AUD =109.75JPY

1D+0.5%▲