AUD Market Update
04 Jun 2026 • 00:27 GMT
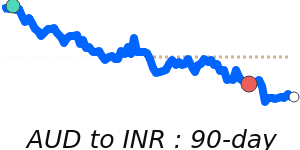
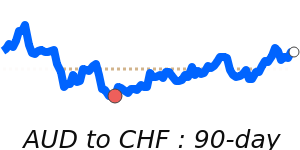
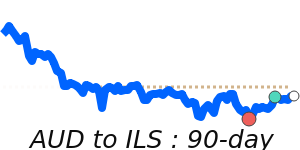
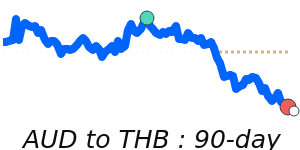
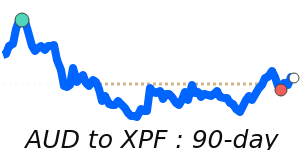
The Australian dollar remains near its weekly low versus the US dollar, influenced by expectations of limited RBA rate hikes and concerns about geopolitical tensions in the Middle East. Currently, the AUD/USD is around 0.7134, just slightly above its 3-month average of 0.7096, trading within a stable range of about 5.9%.
Market watchers are paying close attention to upcoming RBA decisions, as the central bank keeps its rates steady amid softer inflation data and global risk concerns. Meanwhile, the US dollar is gaining strength from safe-haven buying amid ongoing geopolitical issues and a busy week of US economic data, which may support further USD rallies.
Although some forecasts see the AUD edging toward 0.70 by year’s end, persistent global uncertainties could keep the currency within its recent range for now. Watch for any signs of RBA policy change or shifts in risk sentiment, as these could influence the AUD’s direction in the near term.
📊 Quick forecast view
🔴 Mild downside
0.7130 – 0.7260
🌍 Global risk sentiment
⚪ Range-bound