AUD Market Update
14 Jul 2026 • 00:30 GMT
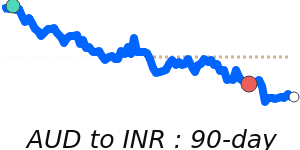
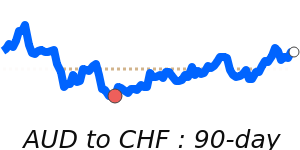
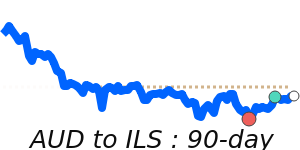
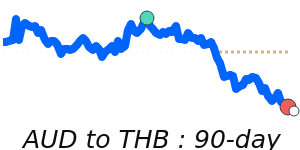
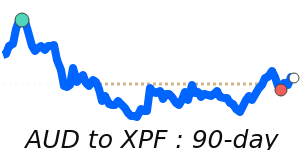
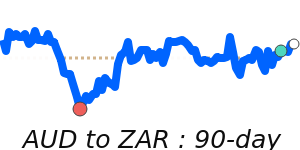
The Australian dollar has recently fallen to its lowest levels in a week, trading near 0.6917 against the U.S. dollar. This is around 2.3% below its three-month average of 0.7084, reflecting some of the pressure from recent global influences. The AUD has been trading within a narrow range, showing 5.4% volatility from 0.6887 to 0.7258 over the past week.
The main factors affecting the AUD include the hawkish policies of both the Reserve Bank of Australia and the U.S. Federal Reserve, which have kept the currency in a tight hold. Rising geopolitical tensions in the Middle East and elevated oil prices have also contributed to cautious risk sentiment, putting some downward pressure on the AUD. However, Australia's energy exports continue to support the currency amid these challenges.
Looking ahead, fluctuations in U.S. interest rates and global risk appetite will be key drivers for the AUD. While some forecasts see the AUD inching higher by year's end, current market conditions suggest traders should stay alert to geopolitical developments and central bank signals that could influence the currency's direction.
📊 Quick forecast view
🔴 Mild downside
0.6770 – 0.6920
🌍 Global risk sentiment
⚪ Range-bound