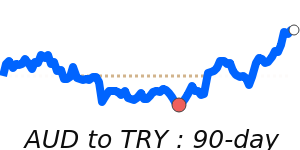
The Australian dollar (AUD) has recently experienced a surge, notably following the Reserve Bank of Australia's (RBA) decision to keep interest rates unchanged, which diverged from market expectations of a rate cut. This decision has been interpreted as a cautious acknowledgment of ongoing global economic uncertainties, providing a boost to the AUD. The market's risk-on sentiment was further propelled by news of a delay in tariff implementations by former President Donald Trump, which alleviated immediate trade concerns.
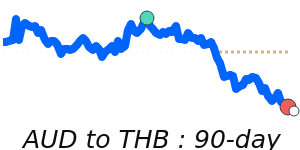
However, the AUD's upward momentum is facing challenges from several factors. Recent declines in key commodity prices, particularly for iron ore and coal, have exerted downward pressure on the currency, impacting export revenues. As a commodity currency, the AUD's value is closely linked to the performance of Australian exports, and fluctuations in these prices typically lead to significant movements in the exchange rates.
Investor sentiment has also been dampened by weaker-than-expected economic data from China, Australia’s largest trading partner. This has raised concerns about future demand for Australian goods, consequently affecting the AUD negatively. Analysts note that geopolitical tensions and rising global inflation have caused a flight to safer assets, leading to increased dominance of safe-haven currencies like the US dollar, further contributing to the AUD's volatility.
Recent employment figures from Australia showed a surprising decline, which could prompt further apprehension regarding economic growth. As market participants digest comments from key figures such as RBA Deputy Governor Andrew Hauser, any indications regarding future monetary policy will be closely watched and could influence the currency's direction.
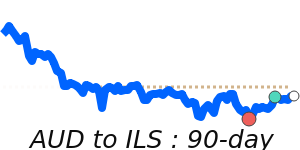
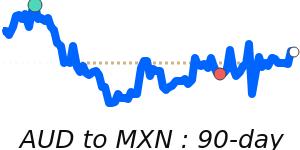
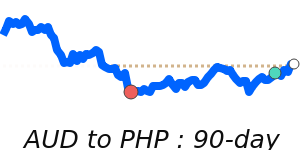
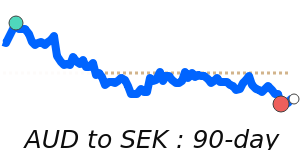
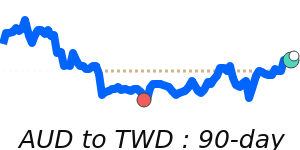
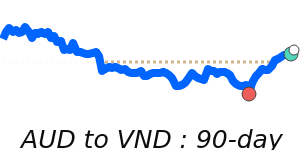
In terms of current performance, the AUD to USD stands at 0.6523, which is 1.1% above its three-month average of 0.6449, highlighting a stable trading range. Conversely, the AUD to EUR trading at 0.5564 is 1.4% below its three-month average, while the AUD to GBP remains near its average, indicating a more stable position. The AUD to JPY is currently at 95.82, reflecting a 2.9% increase above the three-month average, marking this as a recent high.
As these market dynamics evolve, keeping an eye on the interplay between commodity prices, interest rate policies, and geopolitical developments will be essential for those engaged in international transactions involving the AUD. Continuous updates will provide further insights into the currency market moving forward.