Switch .com Best Exchange Rates .com Best Exchange Rates .com Best Exchange Rates
BER

Euro Markets

EUR Currency Update - Our review of Euro forecasts and news plus charts and historic rates. Check EUR Trends over various time periods.


The euro (EUR) is experiencing notable volatility ahead of the Trump-Putin summit in Alaska, which centers on discussions regarding Ukraine. This geopolitical event has led to a weakening of the euro against some of its peers, compounded by a strong negative correlation with a rising US dollar. Investors are bracing for potential market shifts based on the outcomes and headlines emerging from these talks.

Recent economic data has presented a mixed picture for the euro. European banks reported strong Q2 earnings, propelling the sector index to its highest level since 2008. However, concerns persist about the euro's appreciable rise of 12% against the US dollar, which poses challenges for exporters, particularly in the energy and materials sectors. Analysts foresee the euro potentially reaching $1.17 by October and $1.20 over the next year, driven by geopolitical tensions and unease over US fiscal policies.

Additional factors to consider include the progress of the European Central Bank’s digital euro initiative, with a potential launch targeted for 2025-2026, which may reshape monetary policy in the future. Bulgaria's imminent accession to the eurozone on January 1, 2026, is also expected to influence economic dynamics in the region.

In recent trading, the EUR/USD pair has reached 14-day highs near 1.1705, outperforming its 3-month average of 1.1565 by 1.2%. Meanwhile, the EUR/GBP has been relatively stable at 0.8632, just 0.7% above its 3-month average, whereas EUR/JPY is trading at 172.2, which is 2.1% higher than its 3-month average. The euro remains sensitive to broader economic developments, particularly as the ongoing war in Ukraine continues to impact market sentiment.

In the context of oil prices, the current price of Brent Crude OIL/USD at 65.85, which is 3.8% below its 3-month average, could further affect the euro's trajectory, especially considering that energy prices impact the Eurozone’s economic performance.

Looking ahead, the euro's performance will hinge on key factors including ECB monetary policy decisions, economic recovery metrics, and ongoing geopolitical developments in Europe. As countries navigate through these challenges, the implications for international transactions may be significant, suggesting that businesses and individuals should keep a close watch on these dynamics.


Euro to US dollar - EUR/USD Trend

 
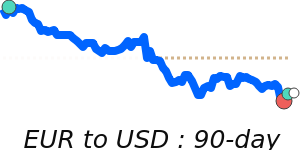
EUR to USD is at 14-day highs near 1.1705, 1.2% above its 3-month average of 1.1565, having traded in a quite stable 5.8% range from 1.1162 to 1.1807
|
 
1 EUR =
1.1705We compare provider deals to this wholesale mid-market rate. Read more
USD
 
+0.5%
14d-highs
 
Track Rate

View My Rate Tracker


Compare & Save on Exchange Rates

Exchange rates can vary significantly between banks and currency exchange providers, so it's important to compare rates from different sources before making a conversion.

The below table makes it easy to calculate and compare the Total Cost you are being charged on currency rates and the possible savings of using a foreign exchange provider rather than your bank.


Loading exchange rates...


Top EUR Rates


Euro to US dollar
EURUSD 90 day chart

EUR to USD is at 14-day highs near 1.1705, 1.2% above its 3-month average of 1.1565, having traded in a quite stable 5.8% range from 1.1162 to 1.1807
EUR to USD
1.1705
+0.5%
14d-highs

Euro to Canadian dollar
EURCAD 90 day chart

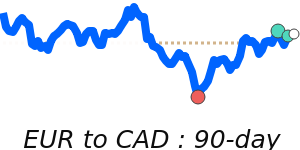
EUR to CAD is at 90-day highs near 1.6178, 1.9% above its 3-month average of 1.5872, having traded in a very stable 3.8% range from 1.5581 to 1.6178
EUR to CAD
1.6178
+0.5%
90d-highs

Euro to British pound
EURGBP 90 day chart

EUR to GBP at 0.8632 is just 0.7% above its 3-month average of 0.857, having traded in a quite stable 4.4% range from 0.8383 to 0.8754
EUR to GBP
0.8632
+0.3%
30d-lows

Euro to Malaysian ringgit
EURMYR 90 day chart

EUR to MYR at 4.9312 is just 0.5% above its 3-month average of 4.9048, having traded in a quite stable 4.6% range from 4.7710 to 4.9899
EUR to MYR
4.9312
+0.5%

Euro to Australian dollar
EURAUD 90 day chart

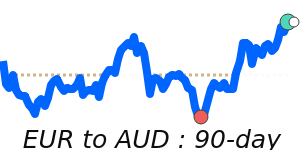
EUR to AUD is at 30-day highs near 1.7991, 1.2% above its 3-month average of 1.7779, having traded in a very stable 3.7% range from 1.7395 to 1.8039
EUR to AUD
1.7991
+0.3%
30d-highs

Euro to United Arab Emirates dirham
EURAED 90 day chart

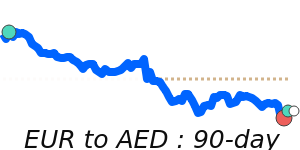
EUR to AED is at 14-day highs near 4.2992, 1.2% above its 3-month average of 4.2478, having traded in a quite stable 5.8% range from 4.0998 to 4.3366
EUR to AED
4.2991
+0.5%
14d-highs

Euro to Swiss franc
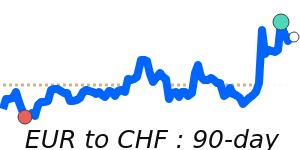
EURCHF 90 day chart

EUR to CHF is at 90-day highs near 0.9441, just 0.9% above its 3-month average of 0.936, having traded in a stable 1.8% range from 0.9273 to 0.9441
EUR to CHF
0.9441
+0.4%
90d-highs

Euro to Singapore dollar
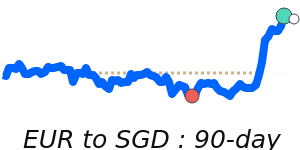
EURSGD 90 day chart

EUR to SGD is at 14-day highs near 1.5017, 1.1% above its 3-month average of 1.4852, having traded in a very stable 3.8% range from 1.4521 to 1.5067
EUR to SGD
1.5016
+0.3%
14d-highs

A-Z


Euro to Australian dollar
EURAUD 90 day chart

EUR to AUD is at 30-day highs near 1.7991, 1.2% above its 3-month average of 1.7779, having traded in a very stable 3.7% range from 1.7395 to 1.8039
EUR to AUD
1.7991
+0.3%
30d-highs

Euro to Brazilian real
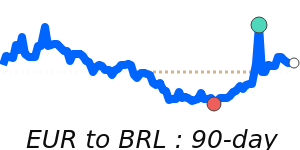
EURBRL 90 day chart

EUR to BRL at 6.3221 is 1.4% below its 3-month average of 6.4095, having traded in a very stable 3.9% range from 6.2933 to 6.5414
EUR to BRL
6.3221
+0.2%

Euro to Canadian dollar
EURCAD 90 day chart

EUR to CAD is at 90-day highs near 1.6178, 1.9% above its 3-month average of 1.5872, having traded in a very stable 3.8% range from 1.5581 to 1.6178
EUR to CAD
1.6178
+0.5%
90d-highs

Euro to Swiss franc
EURCHF 90 day chart

EUR to CHF is at 90-day highs near 0.9441, just 0.9% above its 3-month average of 0.936, having traded in a stable 1.8% range from 0.9273 to 0.9441
EUR to CHF
0.9441
+0.4%
90d-highs

Euro to Chinese yuan
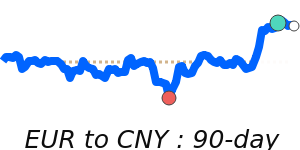
EURCNY 90 day chart

EUR to CNY is at 14-day highs near 8.4065, 1.2% above its 3-month average of 8.3063, having traded in a quite stable 5.1% range from 8.0470 to 8.4598
EUR to CNY
8.4065
+0.5%
14d-highs

Euro to Czech Republic horuna
EURCZK 90 day chart

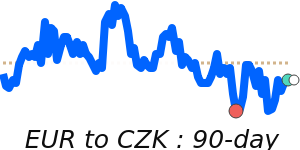
EUR to CZK at 24.47 is just 0.9% below its 3-month average of 24.7, having traded in a very stable 2.2% range from 24.41 to 24.94
EUR to CZK
24.47
-0.1%

Euro to Danish krone
EURDKK 90 day chart

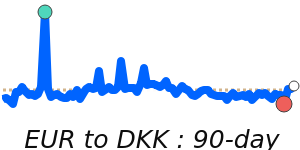
EUR to DKK is at 30-day lows near 7.4623, near its 3-month average, having traded in a stable 0.2% range from 7.4566 to 7.4691
EUR to DKK
7.4639
1d 0.0%
30d-lows

Euro to British pound
EURGBP 90 day chart

EUR to GBP at 0.8632 is just 0.7% above its 3-month average of 0.857, having traded in a quite stable 4.4% range from 0.8383 to 0.8754
EUR to GBP
0.8632
+0.3%
30d-lows

Euro to Hong Kong dollar
EURHKD 90 day chart

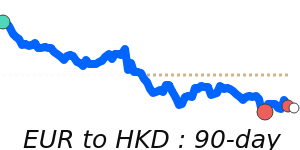
EUR to HKD at 9.1584 is just 0.9% above its 3-month average of 9.0734, having traded in a relatively stable 6.3% range from 8.7222 to 9.2682
EUR to HKD
9.1584
+0.4%
14d-highs

Euro to Hungarian forint
EUR to HUF at 395.4 is 1.2% below its 3-month average of 400.3, having traded in a very stable 2.2% range from 395.2 to 404.0
EUR to HUF
395.39
1d 0.0%
90d-lows

Euro to Indonesian rupiah
EURIDR 90 day chart

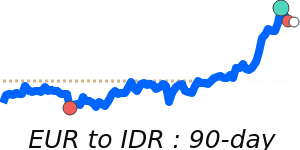
EUR to IDR at 18965 is just 0.6% above its 3-month average of 18854, having traded in a quite stable 4.4% range from 18399 to 19217
EUR to IDR
18,965
+0.7%

Euro to Israeli new sheqel
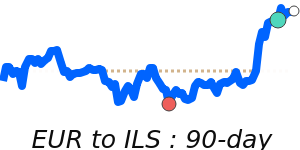
EURILS 90 day chart

EUR to ILS at 3.9556 is just below its 3-month average, having traded in a relatively stable 7.9% range from 3.8525 to 4.1562
EUR to ILS
3.9556
+0.4%

Euro to Indian rupee
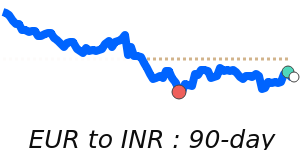
EURINR 90 day chart

EUR to INR is at 90-day highs near 102.4, 2.7% above its 3-month average of 99.72, having traded in a relatively stable 7.2% range from 95.53 to 102.4
EUR to INR
102.43
+0.3%
90d-highs

Euro to Japanese yen
EURJPY 90 day chart

EUR to JPY at 172.2 is 2.1% above its 3-month average of 168.7, having traded in a relatively stable 7.3% range from 161.9 to 173.7
EUR to JPY
172.17
+0.1%

Euro to Mexican peso
EURMXN 90 day chart

EUR to MXN is at 30-day highs near 21.94, just above its 3-month average, having traded in a very stable 3.0% range from 21.53 to 22.18
EUR to MXN
21.94
+0.2%
30d-highs

Euro to Malaysian ringgit
EURMYR 90 day chart

EUR to MYR at 4.9312 is just 0.5% above its 3-month average of 4.9048, having traded in a quite stable 4.6% range from 4.7710 to 4.9899
EUR to MYR
4.9312
+0.5%

Euro to Norwegian krone
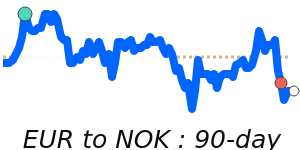
EURNOK 90 day chart

EUR to NOK at 11.93 is 1.7% above its 3-month average of 11.73, having traded in a quite stable 5.0% range from 11.41 to 11.98
EUR to NOK
11.93
+0.3%

Euro to New Zealand dollar
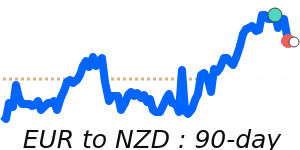
EURNZD 90 day chart

EUR to NZD is at 90-day highs near 1.9758, 2.3% above its 3-month average of 1.9318, having traded in a quite stable 4.7% range from 1.8878 to 1.9758
EUR to NZD
1.9758
+0.4%
90d-highs

Euro to Omani rial
EUR to OMR at 0.4498 is 1.1% above its 3-month average of 0.4447, having traded in a quite stable 5.7% range from 0.4297 to 0.4540
EUR to OMR
0.4498
+0.4%
14d-highs

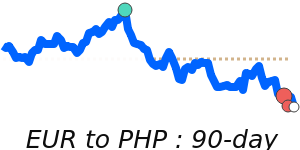
Euro to Philippine peso
EURPHP 90 day chart

EUR to PHP is at 7-day highs near 66.84, 2.2% above its 3-month average of 65.4, having traded in a relatively stable 7.9% range from 62.29 to 67.20
EUR to PHP
66.84
+0.6%

Euro to Pakistani rupee
EURPKR 90 day chart

EUR to PKR at 330.1 is just 0.7% above its 3-month average of 327.7, having traded in a relatively stable 6.9% range from 314.2 to 336.0
EUR to PKR
330.13
+0.1%

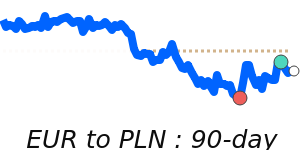
Euro to Polish zloty
EURPLN 90 day chart

EUR to PLN at 4.2591 is near its 3-month average, having traded in a stable 1.3% range from 4.2353 to 4.2886
EUR to PLN
4.2591
-0.1%

Euro to Qatari rial
EUR to QAR is at 14-day highs near 4.2613, 1.1% above its 3-month average of 4.2136, having traded in a quite stable 5.8% range from 4.0665 to 4.3036
EUR to QAR
4.2613
+0.5%
14d-highs

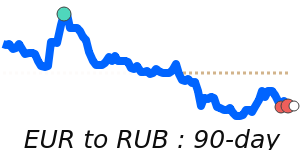
Euro to Russian ruble
EURRUB 90 day chart

EUR to RUB is at 14-day highs near 93.77, 2.5% above its 3-month average of 91.44, having traded in a relatively stable 7.6% range from 87.58 to 94.27
EUR to RUB
93.76
+0.9%
14d-highs

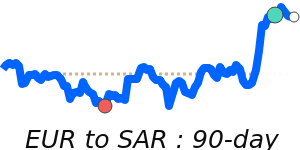
Euro to Saudi riyal
EURSAR 90 day chart

EUR to SAR is at 14-day highs near 4.3919, 1.2% above its 3-month average of 4.3382, having traded in a quite stable 5.8% range from 4.1866 to 4.4277
EUR to SAR
4.3919
+0.5%
14d-highs

Euro to Swedish krona
EURSEK 90 day chart

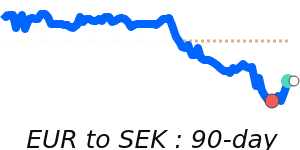
EUR to SEK is at 7-day highs near 11.19, just 0.9% above its 3-month average of 11.09, having traded in a quite stable 4.5% range from 10.82 to 11.31
EUR to SEK
11.19
+0.3%

Euro to Singapore dollar
EURSGD 90 day chart

EUR to SGD is at 14-day highs near 1.5017, 1.1% above its 3-month average of 1.4852, having traded in a very stable 3.8% range from 1.4521 to 1.5067
EUR to SGD
1.5016
+0.3%
14d-highs

Euro to Thai baht
EURTHB 90 day chart

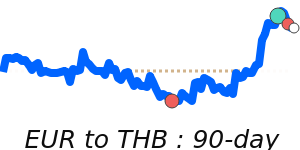
EUR to THB at 37.95 is just 0.9% above its 3-month average of 37.63, having traded in a very stable 3.7% range from 36.94 to 38.32
EUR to THB
37.95
+0.3%

Euro to Turkish lira
EURTRY 90 day chart

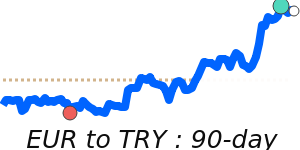
EUR to TRY is at 90-day highs near 47.76, 3.6% above its 3-month average of 46.12, having traded in a quite volatile 10.1% range from 43.37 to 47.76
EUR to TRY
47.76
+0.5%
90d-highs

Euro to New Taiwan dollar
EUR to TWD is at 90-day highs near 35.15, 2.5% above its 3-month average of 34.28, having traded in a quite stable 4.2% range from 33.73 to 35.15
EUR to TWD
35.15
+0.3%
90d-highs

Euro to US dollar
EURUSD 90 day chart

EUR to USD is at 14-day highs near 1.1705, 1.2% above its 3-month average of 1.1565, having traded in a quite stable 5.8% range from 1.1162 to 1.1807
EUR to USD
1.1705
+0.5%
14d-highs

Euro to Vietnamese dong
EUR to VND at 30750 is 1.8% above its 3-month average of 30206, having traded in a relatively stable 6.7% range from 28934 to 30876
EUR to VND
30,750
+0.5%
30d-highs

Euro to Samoan tala
EUR to WST is at 14-day highs near 3.2441, just 0.6% above its 3-month average of 3.2256, having traded in a quite stable 5.8% range from 3.1238 to 3.3059
EUR to WST
3.2441
+0.5%
14d-highs

Euro to Central African franc
EUR to XAF is steady at its 3-month average 656.
EUR to XAF
655.96
1d 0.0%

Euro to East Caribbean dollar
EUR to XCD is at 14-day highs near 3.1633, 1.2% above its 3-month average of 3.1256, having traded in a quite stable 5.8% range from 3.0166 to 3.1908
EUR to XCD
3.1633
+0.5%
14d-highs

Euro to West African franc
EURXOF 90 day chart

EUR to XOF is steady at its 3-month average 656.
EUR to XOF
655.96
1d 0.0%

Euro to CFP franc
EUR to XPF is steady at its 3-month average 119.3.
EUR to XPF
119.33
1d 0.0%

Euro to South African rand
EURZAR 90 day chart

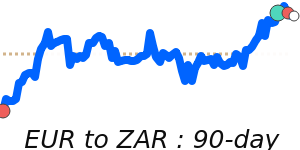
EUR to ZAR at 20.59 is near its 3-month average, having traded in a quite stable 4.4% range from 20.14 to 21.03
EUR to ZAR
20.59
+0.4%
60d-lows