EUR Market Update
11 Jul 2026 • 01:17 GMT
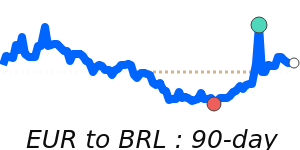
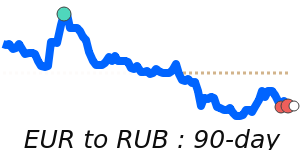
The euro remains slightly weaker against the US dollar, trading around 1.1420, which is about 1.6% below its three-month average of 1.1601. Despite recent economic data supporting eurozone growth, overall trends suggest the euro may face resistance near current levels. The dollar’s cautious stance, driven by mixed US economic signals, keeps EUR/USD within a relatively narrow range.
While some analysts expect the euro to recover, with forecasts suggesting a move towards 1.15 or even higher by the end of the year, others highlight that the euros’ recent decline reflects ongoing market caution ahead of potential ECB policy adjustments. The euro has recently traded in a stable range from approximately 1.1360 to 1.1800, and while the 1.1420 mark is below its recent average, the overall picture remains balanced, with no clear breakout signals yet.
Investors should watch for upcoming European economic data and ECB guidance, which could influence short-term direction. Meanwhile, US data and Federal Reserve outlooks continue to underpin market sentiment. Overall, the euro is poised for cautious movement in the near term as markets digest these economic updates.
📊 Quick forecast view
⚪ Range-bound
1.1420 – 1.1780
🌍 Global risk sentiment
🟢 Uptrend