Switch .com Best Exchange Rates .com Best Exchange Rates .com Best Exchange Rates
BER

Hong Kong dollar Markets

HKD Currency Update - Our review of Hong Kong dollar forecasts and news plus charts and historic rates. Check HKD Trends over various time periods.


The Hong Kong dollar (HKD) has exhibited resilience amid ongoing uncertainties in the U.S. interest rate landscape, particularly through October 2023. Analysts noted that a recent easing of inflation, alongside new government policies introduced by Chief Executive John Lee, aimed at bolstering Hong Kong’s status as a key global financial and trade center, supported the currency's stability. However, the overall economic recovery remains sluggish, presenting challenges for sustained HKD strength.

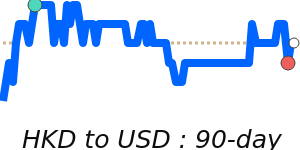
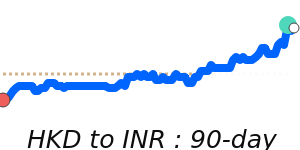
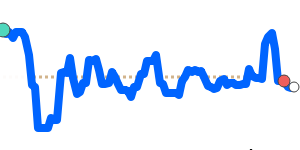
In the face of previously draconian tourism restrictions being relaxed, there remains a pervasive sense of pessimism regarding the city's economic future. While the HKD traded stable against the U.S. dollar during the year, minor fluctuations were observed. Specifically, the HKD to USD exchange rate recently hovered around 0.1274, reaching a 90-day low, just below its 3-month average, indicating limited movement within a narrow range of 1.3%.

Moreover, the domestic government's measures, aimed at revitalizing the property sector, have garnered some market attention, yet the response has been mixed. Reduced stamp duties and eased mortgage conditions showed promise, but the underlying economic indicators, including a GDP growth rate of only 0.4% for Q4 and a PMI score under 50, highlight the prevailing economic headwinds. Therefore, future HKD strength is contingent on a more robust economic bounce-back and the Federal Reserve’s interest rate policy.

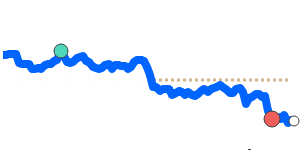
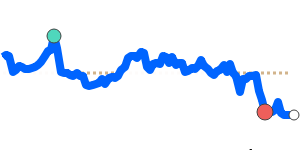
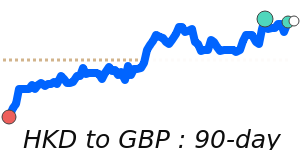
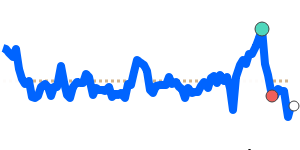
Conversely, the HKD showed some upward momentum against the Euro and the British pound, with exchange rates reaching 14-day highs of 0.1090 and 0.094379 respectively. Despite these gains, the HKD's performance relative to the euro falls 2.6% below its 3-month average, suggesting possible volatility. Additionally, against the Japanese yen, the HKD is performing relatively well, currently trading at 18.78, above its 3-month average and reflecting a stable trading range.

Overall, market sentiment remains cautious, with analysts observing that the HKD’s strength in the coming months will largely depend on the degree of recovery in the local economy and any shifts in the Federal Reserve’s stance on interest rates.


US dollar to Hong Kong dollar - USD/HKD Trend

 
USD to HKD is at 90-day highs near 7.8502, just above its 3-month average, having traded in a stable 1.3% range from 7.7500 to 7.8502
|
 
1 USD =
7.8498We compare provider deals to this wholesale mid-market rate. Read more
HKD
 
90d-highs
 
Track Rate

View My Rate Tracker


Compare & Save on Exchange Rates

Exchange rates can vary significantly between banks and currency exchange providers, so it's important to compare rates from different sources before making a conversion.

The below table makes it easy to calculate and compare the Total Cost you are being charged on currency rates and the possible savings of using a foreign exchange provider rather than your bank.


Loading exchange rates...


Top HKD Rates


Hong Kong dollar to US dollar
HKDUSD 90 day chart

HKD to USD is at 90-day lows near 0.1274, just below its 3-month average, having traded in a stable 1.3% range from 0.1274 to 0.1290
HKD to USD
0.1274
90d-lows

Hong Kong dollar to Euro
HKDEUR 90 day chart

HKD to EUR is at 14-day highs near 0.1090, 2.6% below its 3-month average of 0.1119, having traded in a relatively stable 7.3% range from 0.1079 to 0.1158
HKD to EUR
0.1090
+0.1%
14d-highs

Hong Kong dollar to Canadian dollar
HKDCAD 90 day chart

HKD to CAD is at 7-day highs near 0.1745, just 1.0% below its 3-month average of 0.1762, having traded in a very stable 4.0% range from 0.1729 to 0.1799
HKD to CAD
0.1745
+0.3%

Hong Kong dollar to British pound
HKDGBP 90 day chart

HKD to GBP is at 14-day highs near 0.094379, just 0.9% below its 3-month average of 0.095212, having traded in a relatively stable 6.4% range from 0.092673 to 0.098559
HKD to GBP
0.094379
+0.6%
14d-highs

Hong Kong dollar to Indian rupee
HKDINR 90 day chart

HKD to INR at 10.93 is near its 3-month average, having traded in a very stable 2.1% range from 10.86 to 11.09
HKD to INR
10.93
+0.1%

Hong Kong dollar to Japanese yen
HKDJPY 90 day chart

HKD to JPY is at 30-day highs near 18.78, 1.6% above its 3-month average of 18.48, having traded in a quite stable 5.0% range from 18.15 to 19.06
HKD to JPY
18.78
+0.8%
30d-highs

Hong Kong dollar to Australian dollar
HKDAUD 90 day chart

HKD to AUD at 0.1936 is 2.3% below its 3-month average of 0.1981, having traded in a relatively stable 6.1% range from 0.1933 to 0.2051
HKD to AUD
0.1936
+0.2%
90d-lows

Hong Kong dollar to Singapore dollar
HKDSGD 90 day chart

HKD to SGD is at 14-day highs near 0.1632, 1.3% below its 3-month average of 0.1654, having traded in a quite stable 5.0% range from 0.1620 to 0.1701
HKD to SGD
0.1632
+0.1%
14d-highs

Hong Kong dollar to Chinese yuan
HKDCNY 90 day chart

HKD to CNY is at 7-day lows near 0.9128, 1.1% below its 3-month average of 0.9235, having traded in a very stable 3.3% range from 0.9126 to 0.9429
HKD to CNY
0.9132
-0.1%

A-Z


Hong Kong dollar to Australian dollar
HKDAUD 90 day chart

HKD to AUD at 0.1936 is 2.3% below its 3-month average of 0.1981, having traded in a relatively stable 6.1% range from 0.1933 to 0.2051
HKD to AUD
0.1936
+0.2%
90d-lows

Hong Kong dollar to Chinese yuan
HKDCNY 90 day chart

HKD to CNY is at 7-day lows near 0.9128, 1.1% below its 3-month average of 0.9235, having traded in a very stable 3.3% range from 0.9126 to 0.9429
HKD to CNY
0.9132
-0.1%

Hong Kong dollar to British pound
HKDGBP 90 day chart

HKD to GBP is at 14-day highs near 0.094379, just 0.9% below its 3-month average of 0.095212, having traded in a relatively stable 6.4% range from 0.092673 to 0.098559
HKD to GBP
0.094379
+0.6%
14d-highs

Hong Kong dollar to Indian rupee
HKDINR 90 day chart

HKD to INR at 10.93 is near its 3-month average, having traded in a very stable 2.1% range from 10.86 to 11.09
HKD to INR
10.93
+0.1%

Hong Kong dollar to Malaysian ringgit
HKDMYR 90 day chart

HKD to MYR is at 14-day highs near 0.5417, 1.1% below its 3-month average of 0.5477, having traded in a relatively stable 6.6% range from 0.5347 to 0.5702
HKD to MYR
0.5417
+0.1%
14d-highs

Hong Kong dollar to Philippine peso
HKDPHP 90 day chart

HKD to PHP is at 7-day lows near 7.1929, near its 3-month average, having traded in a quite stable 4.4% range from 7.0624 to 7.3729
HKD to PHP
7.1962

Hong Kong dollar to Pakistani rupee
HKD to PKR at 36.23 is just above its 3-month average, having traded in a stable 1.3% range from 35.92 to 36.37
HKD to PKR
36.23
-0.1%

Hong Kong dollar to Singapore dollar
HKDSGD 90 day chart

HKD to SGD is at 14-day highs near 0.1632, 1.3% below its 3-month average of 0.1654, having traded in a quite stable 5.0% range from 0.1620 to 0.1701
HKD to SGD
0.1632
+0.1%
14d-highs

Hong Kong dollar to Thai baht
HKDTHB 90 day chart

HKD to THB at 4.1332 is 1.7% below its 3-month average of 4.2067, having traded in a quite stable 5.3% range from 4.1148 to 4.3332
HKD to THB
4.1332
-0.5%