Switch .com Best Exchange Rates .com Best Exchange Rates .com Best Exchange Rates
BER

    New Zealand dollar Exchange Update, Chart & History

    NZD Markets Update - Our review of New Zealand dollar Forecasts and News plus Charts and Historic Rates. Check NZD Trends over various time periods.


    New Zealand dollar (NZD) Market Update

    The New Zealand dollar (NZD) is currently facing uncertainty, as recent developments, including U.S. tariffs announced by President Donald Trump on imports from New Zealand, create significant volatility in the currency markets. Analysts note that further tariffs could dampen demand for New Zealand's key commodities, which play a crucial role in shaping the NZD's value against major currencies.

    Yesterday, the NZD fluctuated widely, as market participants responded to the Federal Reserve's decisions, ongoing trade negotiations, and various global events. With New Zealand's economic data light today, the 'kiwi' is likely to remain sensitive to global risk sentiment. This uncertainty is underscored by the NZD's current position at 0.5911 to the USD, which is 2.3% above its three-month average of 0.5778, reflecting a volatile trading range of 8.5% from 0.5534 to 0.6007.

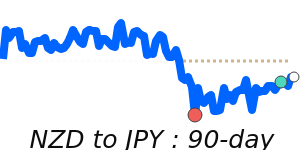
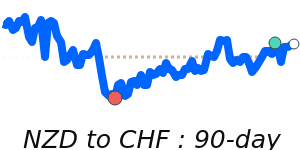
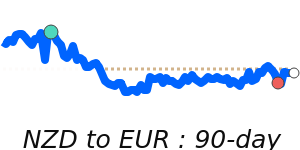
    In contrast, the NZD is trading at near seven-day lows against the Euro at 0.5254, slightly below its three-month average of 0.5297, and has experienced an 8.7% trading range. The NZD also shows vulnerability against the pound, currently at 0.4442, just below the three-month average, having fluctuated in a stable 5.4% range. For the yen, the NZD is trading at 85.93, which is marginally above its average, with a relatively stable trading range of 7.9% observed.

    Market experts indicate that movements in the NZD and AUD are often correlated, owing to their geographic proximity and reliance on commodity exports. As global economic dynamics evolve, especially with the potential for stricter tariffs from a continuation of Trump's policies, the outlook for the NZD remains clouded with risk, necessitating close monitoring of ongoing developments.


    New Zealand dollar to US dollar - NZD/USD Trend

     
    NZD to USD at 0.5911 is 2.3% above its 3-month average of 0.5778, having traded in a fairly volatile 8.5% range from 0.5534 to 0.6007
    |
     
    1 NZD =
    0.5911We compare provider deals to this wholesale mid-market rate. Read more
    USD
     
    +0.1%
    14d-lows
     
    Track Rate

    View My Rate Tracker


    Compare & Save on Exchange Rates

    Exchange rates can vary significantly between banks and currency exchange providers, so it's important to compare rates from different sources before making a conversion.

    The below table makes it easy to calculate and compare the Total Cost you are being charged on currency rates and the possible savings of using a foreign exchange provider rather than your bank.


    Loading exchange rates...


    Top NZD Rates


    New Zealand dollar to US dollar
    NZDUSD 90 day chart

    NZD to USD at 0.5911 is 2.3% above its 3-month average of 0.5778, having traded in a fairly volatile 8.5% range from 0.5534 to 0.6007
    NZD to USD
    0.5911
    +0.1%
    14d-lows

    New Zealand dollar to Australian dollar
    NZDAUD 90 day chart

    NZD to AUD at 0.9223 is just 0.8% above its 3-month average of 0.9149, having traded in a quite stable 4.4% range from 0.8978 to 0.9371
    NZD to AUD
    0.9223

    New Zealand dollar to British pound
    NZDGBP 90 day chart

    NZD to GBP is at 7-day lows near 0.4442, just below its 3-month average, having traded in a quite stable 5.4% range from 0.4335 to 0.4568
    NZD to GBP
    0.4445
    -0.3%

    New Zealand dollar to Japanese yen
    NZDJPY 90 day chart

    NZD to JPY at 85.93 is just 0.9% above its 3-month average of 85.17, having traded in a relatively stable 7.9% range from 80.96 to 87.35
    NZD to JPY
    85.97
    -0.3%

    New Zealand dollar to Fijian dollar
    NZDFJD 90 day chart

    NZD to FJD at 1.3429 is 1.3% above its 3-month average of 1.3252, having traded in a relatively stable 6.5% range from 1.2899 to 1.3742
    NZD to FJD
    1.3429
    +0.7%
    14d-highs

    New Zealand dollar to Tongan paanga
    NZDTOP 90 day chart

    NZD to TOP at 1.4232 is 2.3% above its 3-month average of 1.3913, having traded in a fairly volatile 8.5% range from 1.3326 to 1.4464
    NZD to TOP
    1.4232
    +0.1%
    14d-lows

    New Zealand dollar to Malaysian ringgit
    NZDMYR 90 day chart

    NZD to MYR is at 7-day highs near 2.5426, near its 3-month average, having traded in a relatively stable 6.3% range from 2.4765 to 2.6329
    NZD to MYR
    2.5426
    +0.6%

    New Zealand dollar to Samoan tala
    NZD to WST at 1.6551 is 2.3% above its 3-month average of 1.618, having traded in a fairly volatile 8.5% range from 1.5497 to 1.6821
    NZD to WST
    1.6551
    +0.1%
    14d-lows

    A-Z


    New Zealand dollar to Australian dollar
    NZDAUD 90 day chart

    NZD to AUD at 0.9223 is just 0.8% above its 3-month average of 0.9149, having traded in a quite stable 4.4% range from 0.8978 to 0.9371
    NZD to AUD
    0.9223

    New Zealand dollar to Canadian dollar
    NZDCAD 90 day chart

    NZD to CAD at 0.8241 is just 0.8% above its 3-month average of 0.8178, having traded in a quite stable 5.5% range from 0.7894 to 0.8331
    NZD to CAD
    0.8241
    +0.2%

    New Zealand dollar to Swiss franc
    NZDCHF 90 day chart

    NZD to CHF at 0.4916 is 1.6% below its 3-month average of 0.4997, having traded in a quite volatile 10.3% range from 0.4692 to 0.5175
    NZD to CHF
    0.4916
    +0.1%

    New Zealand dollar to Chinese yuan
    NZDCNY 90 day chart

    NZD to CNY at 4.2709 is 1.6% above its 3-month average of 4.2031, having traded in a fairly volatile 8.2% range from 4.0511 to 4.3824
    NZD to CNY
    4.2709
    +0.1%
    14d-lows

    New Zealand dollar to Euro
    NZDEUR 90 day chart

    NZD to EUR is at 7-day lows near 0.5254, just 0.8% below its 3-month average of 0.5297, having traded in a fairly volatile 8.7% range from 0.5051 to 0.5489
    NZD to EUR
    0.5254
    -0.1%

    New Zealand dollar to Fijian dollar
    NZDFJD 90 day chart

    NZD to FJD at 1.3429 is 1.3% above its 3-month average of 1.3252, having traded in a relatively stable 6.5% range from 1.2899 to 1.3742
    NZD to FJD
    1.3429
    +0.7%
    14d-highs

    New Zealand dollar to British pound
    NZDGBP 90 day chart

    NZD to GBP is at 7-day lows near 0.4442, just below its 3-month average, having traded in a quite stable 5.4% range from 0.4335 to 0.4568
    NZD to GBP
    0.4445
    -0.3%

    New Zealand dollar to Hong Kong dollar
    NZDHKD 90 day chart

    NZD to HKD at 4.5980 is 2.4% above its 3-month average of 4.4901, having traded in a fairly volatile 8.3% range from 4.3008 to 4.6574
    NZD to HKD
    4.5980
    +0.2%

    New Zealand dollar to Indian rupee
    NZDINR 90 day chart

    NZD to INR at 50.49 is 1.4% above its 3-month average of 49.77, having traded in a relatively stable 7.3% range from 47.65 to 51.11
    NZD to INR
    50.49
    -0.6%

    New Zealand dollar to Japanese yen
    NZDJPY 90 day chart

    NZD to JPY at 85.93 is just 0.9% above its 3-month average of 85.17, having traded in a relatively stable 7.9% range from 80.96 to 87.35
    NZD to JPY
    85.97
    -0.3%

    New Zealand dollar to Malaysian ringgit
    NZDMYR 90 day chart

    NZD to MYR is at 7-day highs near 2.5426, near its 3-month average, having traded in a relatively stable 6.3% range from 2.4765 to 2.6329
    NZD to MYR
    2.5426
    +0.6%

    New Zealand dollar to Philippine peso
    NZDPHP 90 day chart

    NZD to PHP is at 14-day lows near 32.73, just 0.8% below its 3-month average of 33, having traded in a relatively stable 6.9% range from 31.79 to 33.97
    NZD to PHP
    32.73
    -0.5%
    14d-lows

    New Zealand dollar to Solomon Islands dollar
    NZD to SBD at 4.9239 is 1.6% above its 3-month average of 4.8451, having traded in a fairly volatile 8.7% range from 4.6027 to 5.0042
    NZD to SBD
    4.9239
    +0.1%
    14d-lows

    New Zealand dollar to Singapore dollar
    NZDSGD 90 day chart

    NZD to SGD at 0.7675 is near its 3-month average, having traded in a quite stable 5.0% range from 0.7491 to 0.7864
    NZD to SGD
    0.7675
    -0.1%
    14d-lows

    New Zealand dollar to Thai baht
    NZDTHB 90 day chart

    NZD to THB at 19.49 is near its 3-month average, having traded in a quite stable 5.4% range from 19.02 to 20.04
    NZD to THB
    19.49

    New Zealand dollar to New Taiwan dollar
    NZDTWD 90 day chart

    NZD to TWD at 17.88 is 4.8% below its 3-month average of 18.79, having traded in a quite volatile 11.9% range from 17.41 to 19.48
    NZD to TWD
    17.88

    New Zealand dollar to US dollar
    NZDUSD 90 day chart

    NZD to USD at 0.5911 is 2.3% above its 3-month average of 0.5778, having traded in a fairly volatile 8.5% range from 0.5534 to 0.6007
    NZD to USD
    0.5911
    +0.1%
    14d-lows

    New Zealand dollar to Vietnamese dong
    NZD to VND at 15348 is 3.4% above its 3-month average of 14845, having traded in a fairly volatile 9.2% range from 14292 to 15611
    NZD to VND
    15,357
    +0.1%
    14d-lows

    New Zealand dollar to Samoan tala
    NZD to WST at 1.6551 is 2.3% above its 3-month average of 1.618, having traded in a fairly volatile 8.5% range from 1.5497 to 1.6821
    NZD to WST
    1.6551
    +0.1%
    14d-lows

    New Zealand dollar to CFP franc
    NZD to XPF is at 7-day lows near 62.69, just 0.8% below its 3-month average of 63.21, having traded in a fairly volatile 8.7% range from 60.27 to 65.51
    NZD to XPF
    62.70
    -0.1%

    New Zealand dollar to South African rand
    NZDZAR 90 day chart

    NZD to ZAR at 10.76 is just above its 3-month average, having traded in a fairly volatile 8.4% range from 10.40 to 11.27
    NZD to ZAR
    10.76
    +0.1%
    30d-lows