The Singapore Dollar (SGD) has faced a challenging environment recently, influenced heavily by escalating trade tensions following U.S. President Donald Trump's announcement of a 10% tariff on imports from Singapore. Analysts note that this move is part of a broader strategy that targets multiple countries, contributing to rising anxieties over a global trade war. As a result, emerging Asian currencies, including the SGD, have witnessed a decline, exacerbating concerns for currency stability in the region.
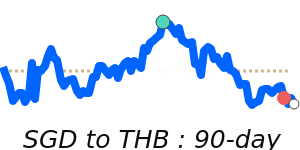
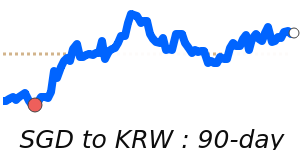
Recent data shows the SGD to USD exchange rate dipping to near 14-day lows at 0.7811, which is 1.1% above its three-month average of 0.7729. This depreciation mirrors the broader trend seen across regional currencies such as the Thai baht and South Korean won, both of which have slid approximately 2%. The decline is compounded by shifts in monetary policy, with several central banks in Asia, responding to economic pressures by cutting interest rates to support growth.
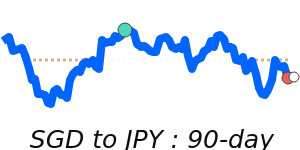
Conversely, the SGD's position against the Japanese yen has strengthened, reaching a notable 90-day high of 114.7, representing a 2.8% increase over its three-month average. This performance indicates a certain resilience within the SGD against the pressures affecting other currencies, possibly due to Singapore's robust trade relationship with the U.S., which remains the city-state’s largest trading partner, accounting for 15% of its total trade.
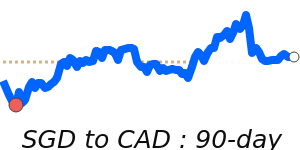
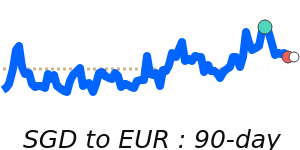
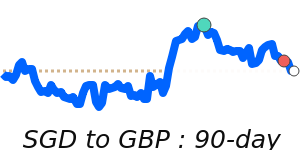
In the European and British markets, the SGD is trading at 0.6663 against the Euro, which is 1.5% below its three-month average, and at 0.5750 against the British pound, which holds steady around its average. These figures reflect a relatively stable trading range amidst external pressures, although the tariffs announced could still influence these positions moving forward.
As the situation evolves, experts recommend close monitoring of currency performance, particularly in relation to ongoing developments in trade policy. For businesses and individuals engaged in international transactions, understanding these dynamics could help optimize currency exchange decisions and minimize costs.