
Latest market analysis
SGD Market Update
28 Jul 2026 • 00:28 GMT
The Singapore dollar has remained relatively stable against the US dollar, with SGD/USD at 0.7743, slightly below its 3-month average of 0.7783. The pair has traded within a narrow range from 0.7708 to 0.7893, reflecting market caution amid ongoing global economic tensions. US economic factors, including inflation data and geopolitical developments, are influencing USD movements. The dollar's recent strength has been supported by rising energy prices due to Middle East tensions and expectations of monetary policy updates from major central banks.
While SGD is holding firm, investors are watching for any potential MAS policy decisions later this year, which could impact the currency’s direction. The USD/SGD exchange rate might see some volatility around resistance at 1.2980 and support near 1.2850, especially if US or Singaporean economic data surprise markets.
Overall, the SGD's position remains steady, trading close to its recent averages with limited volatility. Market participants should stay alert to US inflation releases and geopolitical risks, which could influence the SGD’s short-term moves.
Forecast snapshot
Quick SGD/USD forecast
Near-term bias🔴 Mild downside
Expected range0.7750 – 0.7890
Dominant driver🌍 Global risk sentiment
3-month trend⚪ Range-bound
Stay informed
SGD news & insights
Recent analysis, guides and market developments relevant to the Singapore dollar.


Rate direction
Singapore dollar to US dollar · SGD/USD trend
Review the recent market direction, current mid-market rate and significant movement alerts.
Compare before you exchange
Compare and save on SGD exchange rates
Exchange rates vary between banks and currency providers. Use the comparison below to understand total costs and potential savings against typical bank pricing.
Loading exchange rates...
|
|
|
||
|
|
|
||
|
|
|
||
|
|
|
Explore SGD pairs
Popular SGD exchange rates
Open a currency pair to view its live rate, comparison options, recent trend and market context.
1 SGD =0.7738USD

1d0.0%⬦
1 SGD =1.1098AUD

1d+0.2%▲
1 SGD =3.1620MYR

1d−0.1%▼
1 SGD =74.06INR

1d−0.8%▼
1 SGD =26.04THB
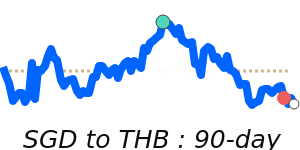
1d−0.1%▼
1 SGD =1,133.6KRW
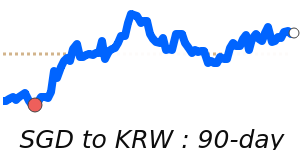
1d+0.4%▲
1 SGD =47.68PHP
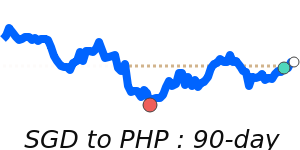
1d0.0%⬦
1 SGD =6.0679HKD
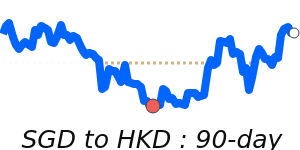
1d0.0%⬦