Switch .com Best Exchange Rates .com Best Exchange Rates .com Best Exchange Rates
BER

Singapore dollar Markets

SGD Currency Update - Our review of Singapore dollar forecasts and news plus charts and historic rates. Check SGD Trends over various time periods.


The recent outlook for the Singapore Dollar (SGD) has been influenced by increasing trade tensions following U.S. President Donald Trump’s announcement of a 10% tariff on imports from Singapore, part of a broader trade conflict impacting multiple economies. Analysts suggest that the renewed fears of a global trade war have led to a decline in risk appetite, considerably affecting regional currencies. The SGD has shown some resilience, but the sentiment surrounding emerging Asian currencies remains pessimistic.

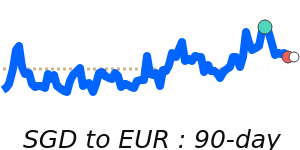
In terms of recent performance, the SGD to USD exchange rate has reached 90-day highs near 0.7869, representing a 2.3% increase above its three-month average of 0.7695. This indicates a stable trading range, reflecting a robust demand for the SGD against the USD amidst the mounting trade anxieties. Conversely, the SGD to EUR has been hit harder, dropping to 60-day lows near 0.6671, which is 1.5% below its three-month average. This trend underscores the impact of external pressures on the SGD relative to the Euro.

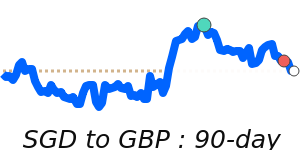
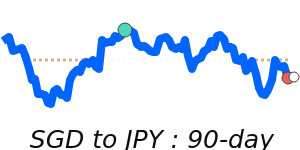
The SGD to GBP exchange rate has remained relatively stable at 0.5729, only marginally below its three-month average of 0.5759. This stability presents a contrast to the movements seen in other currency pairs. Additionally, the SGD to JPY has seen a slight decline, reaching 7-day lows around 113.1, yet remains above its three-month average at 111.2, indicating that the SGD is holding steady against the Japanese Yen within defined trading limits.

With the Monetary Authority of Singapore’s careful management of the SGD against a basket of major currencies, market participants are advised to stay informed about ongoing trade developments, as these could significantly impact exchange rates and international transaction costs in the coming weeks.


Singapore dollar to US dollar - SGD/USD Trend

 
SGD to USD is at 90-day highs near 0.7869, 2.3% above its 3-month average of 0.7695, having traded in a relatively stable 6.5% range from 0.7388 to 0.7869
|
 
1 SGD =
0.7859We compare provider deals to this wholesale mid-market rate. Read more
USD
 
+0.4%
90d-highs
 
Track Rate

View My Rate Tracker


Compare & Save on Exchange Rates

Exchange rates can vary significantly between banks and currency exchange providers, so it's important to compare rates from different sources before making a conversion.

The below table makes it easy to calculate and compare the Total Cost you are being charged on currency rates and the possible savings of using a foreign exchange provider rather than your bank.


Loading exchange rates...


Top SGD Rates


Singapore dollar to US dollar
SGDUSD 90 day chart

SGD to USD is at 90-day highs near 0.7869, 2.3% above its 3-month average of 0.7695, having traded in a relatively stable 6.5% range from 0.7388 to 0.7869
SGD to USD
0.7859
+0.4%
90d-highs

Singapore dollar to Australian dollar
SGDAUD 90 day chart

SGD to AUD at 1.1964 is just below its 3-month average, having traded in a quite stable 5.2% range from 1.1790 to 1.2403
SGD to AUD
1.1984
-0.3%

Singapore dollar to Malaysian ringgit
SGDMYR 90 day chart

SGD to MYR is at 7-day lows near 3.3087, near its 3-month average, having traded in a very stable 3.3% range from 3.2593 to 3.3654
SGD to MYR
3.2910
-0.2%

Singapore dollar to Indian rupee
SGDINR 90 day chart

SGD to INR is at 90-day highs near 67.44, 2.4% above its 3-month average of 65.85, having traded in a relatively stable 6.2% range from 63.51 to 67.44
SGD to INR
67.32
+0.6%
90d-highs

Singapore dollar to Thai baht
SGDTHB 90 day chart

SGD to THB at 25.52 is just above its 3-month average, having traded in a very stable 2.2% range from 25.23 to 25.78
SGD to THB
25.51
-0.2%
30d-highs

Singapore dollar to South Korean won
SGDKRW 90 day chart

SGD to KRW at 1063 is 1.1% below its 3-month average of 1075, having traded in a quite stable 4.4% range from 1053 to 1099
SGD to KRW
1,064.3
-0.6%

Singapore dollar to Philippine peso
SGDPHP 90 day chart

SGD to PHP at 44.32 is 2.4% above its 3-month average of 43.29, having traded in a quite stable 5.0% range from 42.39 to 44.52
SGD to PHP
44.16

Singapore dollar to Hong Kong dollar
SGDHKD 90 day chart

SGD to HKD is at 90-day highs near 6.1769, 2.8% above its 3-month average of 6.0066, having traded in a relatively stable 7.6% range from 5.7414 to 6.1769
SGD to HKD
6.1694
+0.4%
90d-highs

A-Z


Singapore dollar to Australian dollar
SGDAUD 90 day chart

SGD to AUD at 1.1964 is just below its 3-month average, having traded in a quite stable 5.2% range from 1.1790 to 1.2403
SGD to AUD
1.1984
-0.3%

Singapore dollar to Canadian dollar
SGDCAD 90 day chart

SGD to CAD at 1.0705 is just 0.6% above its 3-month average of 1.0642, having traded in a very stable 2.6% range from 1.0506 to 1.0774
SGD to CAD
1.0701
-0.2%

Singapore dollar to Swiss franc
SGDCHF 90 day chart

SGD to CHF is at 60-day lows near 0.6236, 1.7% below its 3-month average of 0.6346, having traded in a relatively stable 6.4% range from 0.6176 to 0.6574
SGD to CHF
0.6231
-0.5%
60d-lows

Singapore dollar to Chinese yuan
SGDCNY 90 day chart

SGD to CNY is at 30-day highs near 5.6372, 1.3% above its 3-month average of 5.5647, having traded in a quite stable 4.9% range from 5.3966 to 5.6630
SGD to CNY
5.6273
+0.3%
30d-highs

Singapore dollar to Euro
SGDEUR 90 day chart

SGD to EUR is at 60-day lows near 0.6671, 1.5% below its 3-month average of 0.6778, having traded in a very stable 3.7% range from 0.6659 to 0.6906
SGD to EUR
0.6671
-0.2%
60d-lows

Singapore dollar to British pound
SGDGBP 90 day chart

SGD to GBP at 0.5729 is just 0.5% below its 3-month average of 0.5759, having traded in a very stable 2.5% range from 0.5685 to 0.5829
SGD to GBP
0.5725
+0.2%
60d-lows

Singapore dollar to Hong Kong dollar
SGDHKD 90 day chart

SGD to HKD is at 90-day highs near 6.1769, 2.8% above its 3-month average of 6.0066, having traded in a relatively stable 7.6% range from 5.7414 to 6.1769
SGD to HKD
6.1694
+0.4%
90d-highs

Singapore dollar to Indonesian rupiah
SGDIDR 90 day chart

SGD to IDR at 12736 is just above its 3-month average, having traded in a very stable 3.8% range from 12424 to 12898
SGD to IDR
12,709
+0.1%

Singapore dollar to Indian rupee
SGDINR 90 day chart

SGD to INR is at 90-day highs near 67.44, 2.4% above its 3-month average of 65.85, having traded in a relatively stable 6.2% range from 63.51 to 67.44
SGD to INR
67.32
+0.6%
90d-highs

Singapore dollar to Japanese yen
SGDJPY 90 day chart

SGD to JPY is at 7-day lows near 113.1, 1.7% above its 3-month average of 111.2, having traded in a quite stable 5.4% range from 108.0 to 113.8
SGD to JPY
113.00

Singapore dollar to Malaysian ringgit
SGDMYR 90 day chart

SGD to MYR is at 7-day lows near 3.3087, near its 3-month average, having traded in a very stable 3.3% range from 3.2593 to 3.3654
SGD to MYR
3.2910
-0.2%

Singapore dollar to Philippine peso
SGDPHP 90 day chart

SGD to PHP at 44.32 is 2.4% above its 3-month average of 43.29, having traded in a quite stable 5.0% range from 42.39 to 44.52
SGD to PHP
44.16

Singapore dollar to Pakistani rupee
SGD to PKR at 223.3 is 3.0% above its 3-month average of 216.9, having traded in a fairly volatile 8.2% range from 207.3 to 224.2
SGD to PKR
223.00
+0.4%

Singapore dollar to Qatari rial
SGD to QAR is at 90-day highs near 2.8654, 2.2% above its 3-month average of 2.8038, having traded in a relatively stable 6.3% range from 2.6944 to 2.8654
SGD to QAR
2.8619
+0.4%
90d-highs

Singapore dollar to Saudi riyal
SGDSAR 90 day chart

SGD to SAR is at 90-day highs near 2.9514, 2.2% above its 3-month average of 2.8866, having traded in a relatively stable 6.4% range from 2.7735 to 2.9514
SGD to SAR
2.9477
+0.4%
90d-highs

Singapore dollar to Thai baht
SGDTHB 90 day chart

SGD to THB at 25.52 is just above its 3-month average, having traded in a very stable 2.2% range from 25.23 to 25.78
SGD to THB
25.51
-0.2%
30d-highs

Singapore dollar to New Taiwan dollar
SGDTWD 90 day chart

SGD to TWD at 22.99 is 2.9% below its 3-month average of 23.68, having traded in a fairly volatile 10.0% range from 22.62 to 24.88
SGD to TWD
23.03
+0.8%
30d-lows

Singapore dollar to US dollar
SGDUSD 90 day chart

SGD to USD is at 90-day highs near 0.7869, 2.3% above its 3-month average of 0.7695, having traded in a relatively stable 6.5% range from 0.7388 to 0.7869
SGD to USD
0.7859
+0.4%
90d-highs

Singapore dollar to Vietnamese dong
SGD to VND is at 90-day highs near 20553, 2.8% above its 3-month average of 19991, having traded in a relatively stable 8.0% range from 19033 to 20553
SGD to VND
20,523
+0.5%
90d-highs