Switch .com Best Exchange Rates .com Best Exchange Rates .com Best Exchange Rates
BER

Singapore dollar Markets

SGD Currency Update - Our review of Singapore dollar forecasts and news plus charts and historic rates. Check SGD Trends over various time periods.


The Singapore dollar (SGD) has faced increased pressure following recent announcements from U.S. President Donald Trump regarding tariffs. The imposition of a 10% reciprocal tariff on Singapore imports has contributed to a negative outlook for the SGD, reflecting broader concerns of a global trade war that have been impacting emerging Asian currencies.

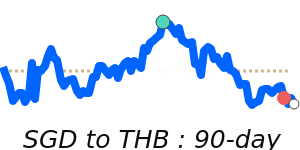
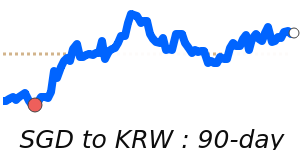
Analysts note that regional currencies, including the SGD, have experienced volatility as market sentiment has soured. The Thai baht and South Korean won have both declined approximately 2%, indicating a shift away from risk appetite amongst investors. This trend has resulted in a reversal of some of the earlier January gains seen in Asian currencies, particularly as several regional central banks opt for interest rate cuts to stimulate economic growth.

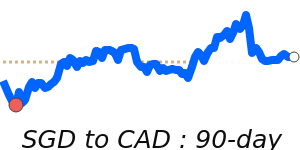
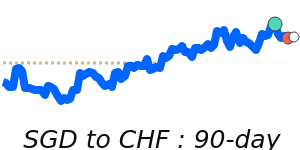
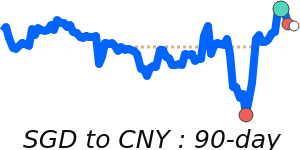
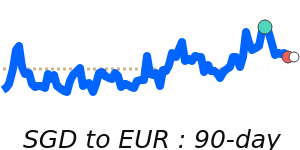
In terms of recent price movements, the SGD to USD exchange rate stands at 0.7857, significantly above its three-month average of 0.7699, representing a 2.1% increase. The SGD has remained relatively stable within a 6.4% range, fluctuating between 0.7388 and 0.7864. Conversely, the SGD to EUR is currently at 90-day lows near 0.6654, which is 1.7% below its three-month average of 0.6775, having held a steady range from 0.6654 to 0.6906.

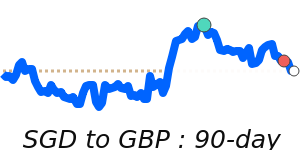
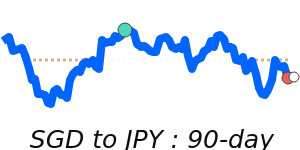
The SGD to GBP exchange rate is at 0.5717, just 0.7% below its three-month average of 0.5758, indicative of consistent trading within a range of 0.5685 to 0.5829. Meanwhile, the SGD to JPY is at recent lows of 112.7, slightly above its three-month average of 111.2, maintaining a stable range from 108.0 to 113.8.

Given that the U.S. is Singapore's largest trading partner, accounting for 15% of total trade, any fluctuations in the SGD could have significant implications for businesses engaged in international transactions. The Monetary Authority of Singapore actively manages the SGD against a basket of currencies from major trading partners, highlighting the importance of currency stability in maintaining trade relations. Ultimately, ongoing developments in trade negotiations and economic policies will be crucial in determining the future direction of the SGD.


Singapore dollar to US dollar - SGD/USD Trend

 
SGD to USD at 0.7857 is 2.1% above its 3-month average of 0.7699, having traded in a relatively stable 6.4% range from 0.7388 to 0.7864
|
 
1 SGD =
0.7849We compare provider deals to this wholesale mid-market rate. Read more
USD
 
-0.1%
90d-highs
 
Track Rate

View My Rate Tracker


Compare & Save on Exchange Rates

Exchange rates can vary significantly between banks and currency exchange providers, so it's important to compare rates from different sources before making a conversion.

The below table makes it easy to calculate and compare the Total Cost you are being charged on currency rates and the possible savings of using a foreign exchange provider rather than your bank.


Loading exchange rates...


Top SGD Rates


Singapore dollar to US dollar
SGDUSD 90 day chart

SGD to USD at 0.7857 is 2.1% above its 3-month average of 0.7699, having traded in a relatively stable 6.4% range from 0.7388 to 0.7864
SGD to USD
0.7849
-0.1%
90d-highs

Singapore dollar to Australian dollar
SGDAUD 90 day chart

SGD to AUD at 1.1940 is just 0.5% below its 3-month average of 1.2001, having traded in a quite stable 5.2% range from 1.1790 to 1.2403
SGD to AUD
1.1980
-0.1%

Singapore dollar to Malaysian ringgit
SGDMYR 90 day chart

SGD to MYR is at 14-day lows near 3.2979, just below its 3-month average, having traded in a very stable 3.3% range from 3.2593 to 3.3654
SGD to MYR
3.3195
-0.4%
14d-lows

Singapore dollar to Indian rupee
SGDINR 90 day chart

SGD to INR is at 90-day highs near 67.39, 2.2% above its 3-month average of 65.89, having traded in a relatively stable 6.1% range from 63.51 to 67.39
SGD to INR
67.22
90d-highs

Singapore dollar to Thai baht
SGDTHB 90 day chart

SGD to THB at 25.51 is just above its 3-month average, having traded in a very stable 2.2% range from 25.23 to 25.78
SGD to THB
25.44
30d-highs

Singapore dollar to South Korean won
SGDKRW 90 day chart

SGD to KRW at 1064 is 1.0% below its 3-month average of 1075, having traded in a quite stable 4.4% range from 1053 to 1099
SGD to KRW
1,066.5

Singapore dollar to Philippine peso
SGDPHP 90 day chart

SGD to PHP is at 14-day lows near 44.20, 2.1% above its 3-month average of 43.3, having traded in a quite stable 5.0% range from 42.39 to 44.52
SGD to PHP
44.23
-0.2%
14d-lows

Singapore dollar to Hong Kong dollar
SGDHKD 90 day chart

SGD to HKD at 6.1662 is 2.6% above its 3-month average of 6.0104, having traded in a relatively stable 7.5% range from 5.7414 to 6.1731
SGD to HKD
6.1616
-0.1%
90d-highs

A-Z


Singapore dollar to Australian dollar
SGDAUD 90 day chart

SGD to AUD at 1.1940 is just 0.5% below its 3-month average of 1.2001, having traded in a quite stable 5.2% range from 1.1790 to 1.2403
SGD to AUD
1.1980
-0.1%

Singapore dollar to Canadian dollar
SGDCAD 90 day chart

SGD to CAD at 1.0718 is just 0.7% above its 3-month average of 1.0643, having traded in a very stable 2.6% range from 1.0506 to 1.0774
SGD to CAD
1.0712
+0.1%

Singapore dollar to Swiss franc
SGDCHF 90 day chart

SGD to CHF is at 60-day lows near 0.6213, 2.0% below its 3-month average of 0.6341, having traded in a quite stable 6.0% range from 0.6176 to 0.6548
SGD to CHF
0.6220
-0.4%
60d-lows

Singapore dollar to Chinese yuan
SGDCNY 90 day chart

SGD to CNY at 5.6296 is 1.1% above its 3-month average of 5.5669, having traded in a quite stable 4.9% range from 5.3966 to 5.6630
SGD to CNY
5.6260
-0.1%
30d-highs

Singapore dollar to Euro
SGDEUR 90 day chart

SGD to EUR is at 90-day lows near 0.6654, 1.7% below its 3-month average of 0.6775, having traded in a very stable 3.8% range from 0.6654 to 0.6906
SGD to EUR
0.6673
-0.2%
90d-lows

Singapore dollar to British pound
SGDGBP 90 day chart

SGD to GBP at 0.5717 is just 0.7% below its 3-month average of 0.5758, having traded in a very stable 2.5% range from 0.5685 to 0.5829
SGD to GBP
0.5770
-0.2%
60d-lows

Singapore dollar to Hong Kong dollar
SGDHKD 90 day chart

SGD to HKD at 6.1662 is 2.6% above its 3-month average of 6.0104, having traded in a relatively stable 7.5% range from 5.7414 to 6.1731
SGD to HKD
6.1616
-0.1%
90d-highs

Singapore dollar to Indonesian rupiah
SGDIDR 90 day chart

SGD to IDR is at 7-day highs near 12750, just above its 3-month average, having traded in a very stable 3.8% range from 12424 to 12898
SGD to IDR
12,729
+0.3%

Singapore dollar to Indian rupee
SGDINR 90 day chart

SGD to INR is at 90-day highs near 67.39, 2.2% above its 3-month average of 65.89, having traded in a relatively stable 6.1% range from 63.51 to 67.39
SGD to INR
67.22
90d-highs

Singapore dollar to Japanese yen
SGDJPY 90 day chart

SGD to JPY is at 14-day lows near 112.7, 1.3% above its 3-month average of 111.2, having traded in a quite stable 5.4% range from 108.0 to 113.8
SGD to JPY
112.82
-0.5%
14d-lows

Singapore dollar to Malaysian ringgit
SGDMYR 90 day chart

SGD to MYR is at 14-day lows near 3.2979, just below its 3-month average, having traded in a very stable 3.3% range from 3.2593 to 3.3654
SGD to MYR
3.3195
-0.4%
14d-lows

Singapore dollar to Philippine peso
SGDPHP 90 day chart

SGD to PHP is at 14-day lows near 44.20, 2.1% above its 3-month average of 43.3, having traded in a quite stable 5.0% range from 42.39 to 44.52
SGD to PHP
44.23
-0.2%
14d-lows

Singapore dollar to Pakistani rupee
SGD to PKR at 223.0 is 2.7% above its 3-month average of 217.1, having traded in a fairly volatile 8.2% range from 207.3 to 224.2
SGD to PKR
223.88
-0.5%

Singapore dollar to Qatari rial
SGD to QAR at 2.8597 is 1.9% above its 3-month average of 2.8053, having traded in a relatively stable 6.3% range from 2.6944 to 2.8636
SGD to QAR
2.8615
-0.1%
90d-highs

Singapore dollar to Saudi riyal
SGDSAR 90 day chart

SGD to SAR at 2.9464 is 2.0% above its 3-month average of 2.8881, having traded in a relatively stable 6.3% range from 2.7735 to 2.9494
SGD to SAR
2.9437
-0.1%
90d-highs

Singapore dollar to Thai baht
SGDTHB 90 day chart

SGD to THB at 25.51 is just above its 3-month average, having traded in a very stable 2.2% range from 25.23 to 25.78
SGD to THB
25.44
30d-highs

Singapore dollar to New Taiwan dollar
SGDTWD 90 day chart

SGD to TWD at 22.97 is 2.9% below its 3-month average of 23.66, having traded in a fairly volatile 10.0% range from 22.62 to 24.88
SGD to TWD
22.80
30d-lows

Singapore dollar to US dollar
SGDUSD 90 day chart

SGD to USD at 0.7857 is 2.1% above its 3-month average of 0.7699, having traded in a relatively stable 6.4% range from 0.7388 to 0.7864
SGD to USD
0.7849
-0.1%
90d-highs

Singapore dollar to Vietnamese dong
SGD to VND at 20530 is 2.6% above its 3-month average of 20007, having traded in a relatively stable 7.9% range from 19033 to 20541
SGD to VND
20,540
-0.1%
90d-highs