Switch .com Best Exchange Rates .com Best Exchange Rates .com Best Exchange Rates
BER

South African rand Markets

ZAR Currency Update - Our review of South African rand forecasts and news plus charts and historic rates. Check ZAR Trends over various time periods.


The South African Rand (ZAR) is currently experiencing notable volatility, largely driven by external factors including trade relations and investor sentiment. Recently, the United States imposed a 30% reciprocal tariff on South African goods, a move analysts suggest is part of a broader trade conflict. This development could have significant implications for South Africa's economic stability, particularly as it depends heavily on foreign investment to address its budget and current account deficits.

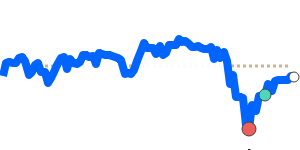
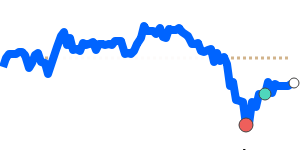
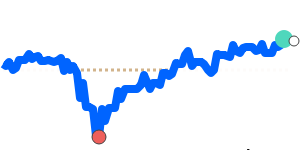
Recent data shows that the ZAR to USD exchange rate is currently at 90-day highs, trading near 0.056472. This figure represents a 3.2% increase over its three-month average of 0.054728. The ZAR/USD pair has exhibited considerable volatility, having fluctuated within an 11.7% range from 0.050563 to 0.056472, reflecting shifting market sentiments.

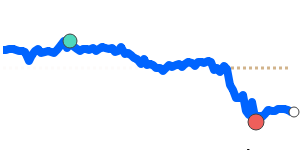
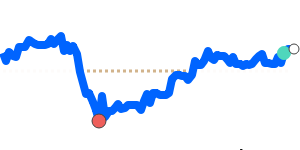
For the ZAR to EUR, the current rate stands at 0.047890, which is only 0.6% lower than its three-month average of 0.048202. This pair has also demonstrated volatility, trading within a fairly broad range of 9.0%, from 0.045978 to 0.050138.

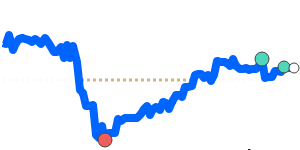
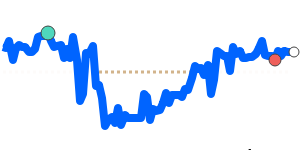
Meanwhile, the ZAR to GBP is at 0.041105, just above its three-month average. This pair has remained relatively stable, operating within a more modest range of 5.7%, between 0.039609 and 0.041873.

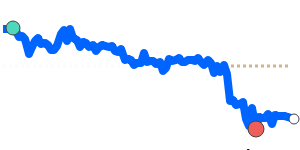
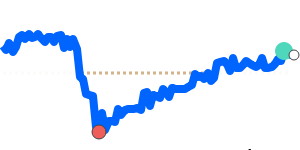
Additionally, the ZAR to JPY is currently at 8.1108, which is 2.6% higher than its three-month average of 7.9089. This currency pair has been quite volatile as well, reflecting a 10.6% trading range from 7.3967 to 8.1817.

Overall, forecasters indicate that the Rand's performance in the near term will be heavily influenced by global economic conditions and domestic stability. Investors will need to monitor these developments closely as they could have significant implications for exchange rates and international transaction costs.


US dollar to South African rand - USD/ZAR Trend

 
USD to ZAR at 17.60 is 3.7% below its 3-month average of 18.27, having traded in a rather volatile 12.5% range from 17.59 to 19.78
|
 
1 USD =
17.60We compare provider deals to this wholesale mid-market rate. Read more
ZAR
 
-0.6%
90d-lows
 
Track Rate

View My Rate Tracker


Compare & Save on Exchange Rates

Exchange rates can vary significantly between banks and currency exchange providers, so it's important to compare rates from different sources before making a conversion.

The below table makes it easy to calculate and compare the Total Cost you are being charged on currency rates and the possible savings of using a foreign exchange provider rather than your bank.


Loading exchange rates...


Top ZAR Rates


South African rand to US dollar
ZARUSD 90 day chart

ZAR to USD at 0.056806 is 3.7% above its 3-month average of 0.054765, having traded in a rather volatile 12.4% range from 0.050563 to 0.056841
ZAR to USD
0.056815
+0.6%
90d-highs

South African rand to Euro
ZAREUR 90 day chart

ZAR to EUR at 0.048127 is near its 3-month average, having traded in a relatively stable 8.0% range from 0.045978 to 0.049660
ZAR to EUR
0.048134
+0.5%

South African rand to Canadian dollar
ZARCAD 90 day chart

ZAR to CAD at 0.077500 is 2.4% above its 3-month average of 0.075698, having traded in a relatively stable 7.8% range from 0.072016 to 0.077653
ZAR to CAD
0.077513
+0.9%

South African rand to British pound
ZARGBP 90 day chart

ZAR to GBP at 0.041328 is just 0.9% above its 3-month average of 0.04095, having traded in a quite stable 5.6% range from 0.039609 to 0.041835
ZAR to GBP
0.041330
+0.5%

South African rand to Indian rupee
ZARINR 90 day chart

ZAR to INR is at 90-day highs near 4.8708, 3.9% above its 3-month average of 4.687, having traded in a quite volatile 11.5% range from 4.3671 to 4.8708
ZAR to INR
4.8634
+0.6%
90d-highs

South African rand to Japanese yen
ZARJPY 90 day chart

ZAR to JPY at 8.1541 is 3.1% above its 3-month average of 7.9103, having traded in a quite volatile 10.6% range from 7.3967 to 8.1817
ZAR to JPY
8.1616
+0.2%

South African rand to Australian dollar
ZARAUD 90 day chart

ZAR to AUD at 0.086326 is 1.1% above its 3-month average of 0.085347, having traded in a quite stable 5.3% range from 0.082755 to 0.087155
ZAR to AUD
0.086334
+0.6%

South African rand to Singapore dollar
ZARSGD 90 day chart

ZAR to SGD at 0.072295 is 1.7% above its 3-month average of 0.071121, having traded in a relatively stable 6.2% range from 0.068437 to 0.072661
ZAR to SGD
0.072315
+0.7%

South African rand to Chinese yuan
ZARCNY 90 day chart

ZAR to CNY at 0.4070 is 2.8% above its 3-month average of 0.396, having traded in a fairly volatile 9.8% range from 0.3710 to 0.4073
ZAR to CNY
0.4071
+0.6%
14d-highs

A-Z


South African rand to Euro
ZAREUR 90 day chart

ZAR to EUR at 0.048127 is near its 3-month average, having traded in a relatively stable 8.0% range from 0.045978 to 0.049660
ZAR to EUR
0.048134
+0.5%

South African rand to British pound
ZARGBP 90 day chart

ZAR to GBP at 0.041328 is just 0.9% above its 3-month average of 0.04095, having traded in a quite stable 5.6% range from 0.039609 to 0.041835
ZAR to GBP
0.041330
+0.5%

South African rand to Indian rupee
ZARINR 90 day chart

ZAR to INR is at 90-day highs near 4.8708, 3.9% above its 3-month average of 4.687, having traded in a quite volatile 11.5% range from 4.3671 to 4.8708
ZAR to INR
4.8634
+0.6%
90d-highs

South African rand to US dollar
ZARUSD 90 day chart

ZAR to USD at 0.056806 is 3.7% above its 3-month average of 0.054765, having traded in a rather volatile 12.4% range from 0.050563 to 0.056841
ZAR to USD
0.056815
+0.6%
90d-highs