Latest market analysis
ZAR Market Update
01 Aug 2026 • 01:10 GMT
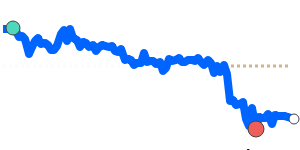
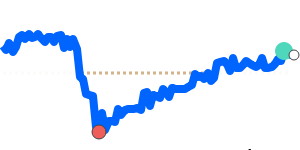
The South African rand remains quite stable against the US dollar, trading around R16.60. Recently, the ZAR has strengthened slightly as the USD regained some of its recent losses ahead of the upcoming Federal Reserve meeting. This has kept the dollar’s recent rally in check, with the ZAR trading just below its three-month average.
The US dollar is showing strength again due to expectations of a hawkish stance from the Fed, with traders watching for potential rate hikes. Meanwhile, the rand benefits from a softer dollar but is also supported by cautious optimism about South Africa’s improving economic outlook and stable inflation outlook, which could lead to further easing of interest rates later this year.
Overall, expect the ZAR to remain relatively steady in the near term, oscillating within its recent range. Any shift in US monetary policy or sudden geopolitical developments could bring some volatility. However, for now, the rand continues to trade in a narrow band, reflecting a balance between global and local factors.
Forecast snapshot
Quick ZAR/USD forecast
Near-term bias🟢 Mild upside
Expected range0.0600 – 0.0630
Dominant driver🏦 Central bank policy divergence
3-month trend🟢 Uptrend
Stay informed
ZAR news & insights
Recent analysis, guides and market developments relevant to the South African rand.


Rate direction
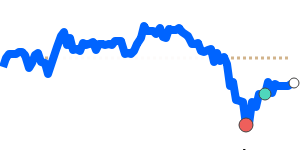
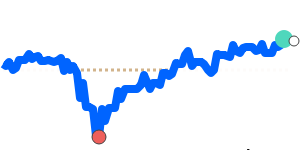
US dollar to South African rand · USD/ZAR trend
Review the recent market direction, current mid-market rate and significant movement alerts.
Compare before you exchange
Compare and save on ZAR exchange rates
Exchange rates vary between banks and currency providers. Use the comparison below to understand total costs and potential savings against typical bank pricing.
Loading exchange rates...
|
|
|
||
|
|
|
||
|
|
|
||
|
|
|
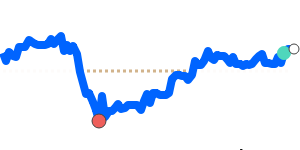
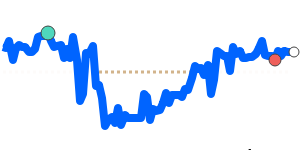
Explore ZAR pairs
Popular ZAR exchange rates
Open a currency pair to view its live rate, comparison options, recent trend and market context.
1 ZAR =0.060741USD
1D−0.4%▼
1 ZAR =0.052596EUR
1D−0.4%▼
1 ZAR =0.085092CAD
1D−0.2%▼
1 ZAR =0.045025GBP
1D−0.5%▼
1 ZAR =5.7943INR
1D−0.5%▼
1 ZAR =9.5667JPY
1D−1.6%▼
1 ZAR =0.086241AUD
1D−0.2%▼
1 ZAR =0.077862SGD
1D−0.2%▼
1 ZAR =0.4101CNY
1D−0.4%▼