The comparison table above helps you see the total cost of your currency transaction by showing the exchange rates offered by different providers. It also makes it easy to spot potential savings from market-leading FX services compared to bank rates.
To see a full list of available providers, simply enter your transaction type, details and click ‘GET RATES’.
THB to USD Market Data
Thai baht (THB) to US dollar (USD) market data - latest interbank exchange rate, trend, chart & historic rates.
Sell THB →
Buy USD
1 THB = 0.030772 USD
▼-0.6%
THB to USD at 0.030630 is 1.4% above its 3-month average of 0.030213, having traded in a relatively stable 7.7% range from 0.028663 to 0.030883
Is the THB to USD Exchange Rate Likely to Improve?
Predicting exchange rate movements is always challenging, as they’re influenced by a wide range of economic and geopolitical factors. One useful way to assess the current value of the Thai baht against the US dollar is to review how the THB/USD rate has changed over time.
The table below shows the percentage change in the THB to USD exchange rate across various timeframes—from the past 2 weeks to the last 20 years:
Date
THB/USD
Period
14 Jun 2025
0.0309
2 Week
30 Mar 2025
0.0294
3 Month
28 Jun 2024
0.0272
1 Year
29 Jun 2020
0.0324
5 Year
01 Jul 2015
0.0296
10 Year
03 Jul 2005
0.0242
20 Year
THB/USD historic rates
USD/THB has dropped to 32.65, a 1.4% decline from the 3-month avg of 33.11, affected by USD weakness and Thai trade pressures. Analysts suggest upcoming US core PCE data could shift sentiment; if inflation rises, it may strengthen the USD. Monitor global trade impacts on THB
@bestfxrates
THB to USD Conversion: What Is Your Money Worth?
To help you understand the real-world value of the current exchange rate, the table below shows how much Thai baht are worth in US dollar across a range of amounts.
This gives a quick view of what you’d get when converting different THB amounts at today’s rate * :
This is always a difficult question as exchange rates are influenced by many factors, so a good method to consider the US dollar current value is to look the USD performance against a range of other currencies over various time periods.
The following table looks at the performance of the USD exchange rate against selections of other currencies over time periods from the previous 2 days back to the last 5 years.
Popular Rates (A - Z)
United Arab Emirates dirham to Indian rupee
AED to INR is at 14-day lows near 23.27, near its 3-month average, having traded in a very stable 3.0% range from 22.93 to 23.61
AUD to EUR is at 60-day lows near 0.5570, 1.4% below its 3-month average of 0.565, having traded in a relatively stable 7.0% range from 0.5436 to 0.5817
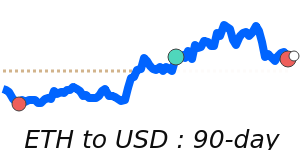
EUR to USD is at 90-day highs near 1.1727, 3.4% above its 3-month average of 1.1342, having traded in a fairly volatile 8.7% range from 1.0793 to 1.1727
NZD to USD is at 14-day highs near 0.6064, 2.2% above its 3-month average of 0.5931, having traded in a fairly volatile 9.7% range from 0.5534 to 0.6070
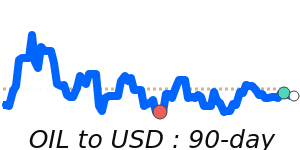
OIL to USD is at 14-day lows near 67.22, just 0.5% above its 3-month average of 66.86, having traded in a highly volatile 31.1% range from 60.14 to 78.85