SGD Market Update
18 Jul 2026 • 01:12 GMT
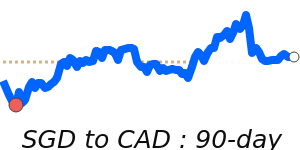
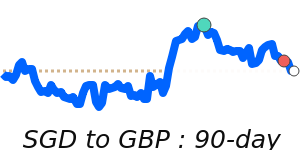
The Singapore Dollar remains steady against major currencies today. Notably, SGD to USD is trading at 0.7745, just 0.6% below its 3-month average of 0.7794. The pair has stayed within a narrow range, reflecting recent stability despite global market fluctuations. The USD has recently been supported by rising energy prices and geopolitical tensions in the Middle East, which tend to boost the dollar. However, weaker US jobs data has tempered some of this momentum, and traders are now eyeing upcoming US inflation figures for a clearer picture.
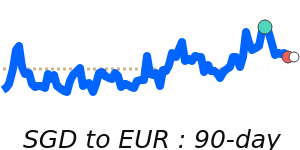
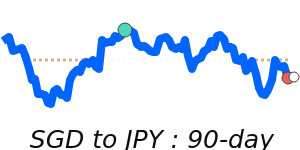
Against the euro, the SGD is near 7-day lows at approximately 0.6768, yet it's just above its three-month average, indicating limited recent movement. The SGD gained slightly against the Japanese yen, reaching 125.8, close to its 90-day high, as the yen remains under pressure amid ongoing risk sentiment and Japanese monetary policy outlooks.
Overall, the SGD’s recent trading pattern shows resilience, with limited movement in the major pairs. Investors continue to watch regional economic data, monetary policy signals from Singapore’s MAS, and US inflation reports that could influence currency directions in the coming weeks.
📊 Quick forecast view
🔴 Mild downside
0.7750 – 0.7890
🌍 Global risk sentiment
🟢 Uptrend