GBP Market Update
30 May 2026 • 01:11 GMT
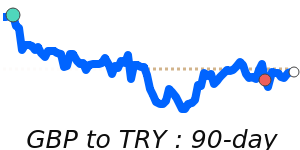
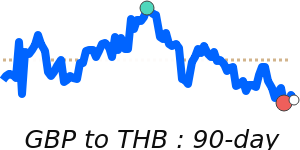
The British Pound has experienced some recent weakness against the US Dollar, trading around 1.3456, slightly above its three-month average. The decline is mainly influenced by dollar strength driven by US inflation concerns and cautious signals from the Federal Reserve. Meanwhile, political uncertainty in the UK and upcoming economic reports may cause further fluctuations.
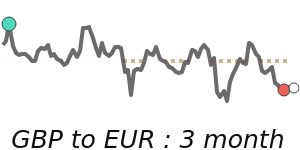
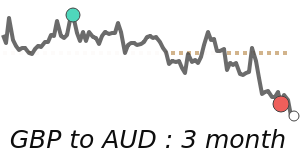
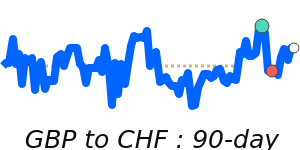
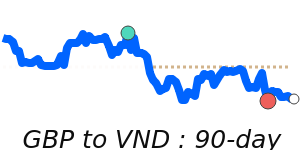
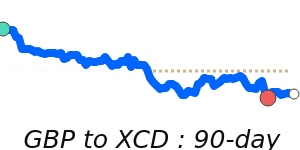
In contrast, GBP has remained relatively stable against the euro, hovering near 1.154, close to its three-month average, with limited volatility. against the Japanese yen, GBP is about 214.4, just above its recent range, supported by limited market surprises. The Pound also reached a seven-day low against the Australian dollar, trading near 1.8704, slightly below its three-month level, reflecting softer risk appetite and regional market sentiment.
Looking ahead, traders should keep an eye on UK inflation data and geopolitical developments, which could influence GBP’s direction. While some forecasts see the Pound strengthening by year-end, volatility remains possible as global economic and political factors evolve.
📊 Quick forecast view
🔴 Mild downside
1.3400 – 1.3630
🌍 Global risk sentiment
⚪ Range-bound