GBP Market Update
23 Jul 2026 • 00:27 GMT
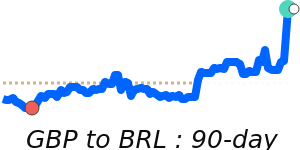
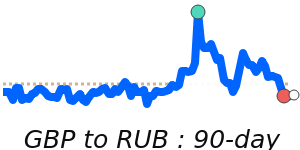
The British pound edged lower against the US dollar, hitting a 7-day low near 1.3360, driven mainly by a strengthening US dollar amid geopolitical concerns in the Middle East. The dollar's safe-haven appeal continues to support its gains, with some analysts eyeing a potential move toward 103-104 on the DXY index. The pound remains within a broad trading range, with recent data pointing to ongoing political uncertainty and economic pressures inside the UK. Meanwhile, the Bank of England's hints at potential rate hikes are providing some support for GBP, though overall sentiment remains cautious.
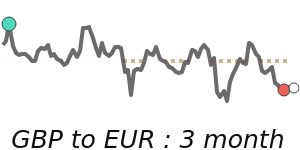
In the broader currency space, the GBP has also softened against the euro, with GBP/EUR dipping towards 1.1720, its lowest in two weeks. This reflects a combination of dollar strength and the euro’s resilience amid signs of economic recovery in the euro area. Looking ahead, market participants will be closely watching upcoming economic data releases and geopolitical developments, which could influence GBP’s momentum. For now, the pound remains relatively stable but vulnerable to shifts in risk appetite and US dollar strength.
📊 Quick forecast view
🔴 Mild downside
1.2940 – 1.3380
🌍 Global risk sentiment
⚪ Range-bound