Switch .com Best Exchange Rates .com Best Exchange Rates .com Best Exchange Rates
BER

British pound Markets

GBP Currency Update - Our review of British pound forecasts and news plus charts and historic rates. Check GBP Trends over various time periods.


The British pound (GBP) has shown signs of recovery, trending higher at the start of the week following Prime Minister Kier Starmer’s endorsement of Chancellor Rachel Reeves. This support has provided some reassurance to investors, allowing the currency to bounce back from a recent sell-off. However, the gains remain modest as concerns about fiscal deficit risks loom, particularly following the government's welfare reform adjustments.

Data releases from the UK have been limited, suggesting that GBP movements may largely reflect broader market trends rather than specific domestic signals. It’s notable that the pound is facing downward pressure from external factors, including the recent implementation of a 10% reciprocal tariff on UK goods by the United States, which could disrupt trade and economic growth.

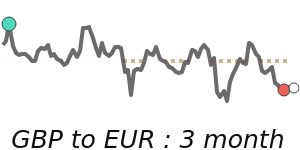
In recent trading, the GBP/USD pair is hovering near 14-day lows at approximately 1.3427, which is aligned with its three-month average. This pair has recently traded within a stable range of 4.3%, indicating limited volatility. Conversely, against the Euro, the GBP has reached 90-day lows at around 1.1510, about 2.0% below its three-month average, signifying potential eurozone influences that have affected sterling’s value.

On a more positive note, the GBP/JPY exchange rate is currently at 198.4, which is 2.0% above its three-month average of 194.5. This pair has demonstrated a stable trading range of 6.0%, suggesting that there is some resilience in GBP against the yen, despite broader uncertainties.

Looking forward, the future trajectory of the pound will hinge on the UK’s economic recovery, potential changes in monetary policy by the Bank of England, and ongoing developments in trade negotiations. Investor confidence remains a crucial driver, especially in a post-Brexit landscape where political and economic stability will significantly impact exchange rates. As such, monitoring economic indicators and political events will be essential for those affected by fluctuations in the currency market.


British pound to US dollar - GBP/USD Trend

 
GBP to USD is at 14-day lows near 1.3427, near its 3-month average, having traded in a quite stable 4.3% range from 1.3176 to 1.3746
|
 
1 GBP =
1.3382We compare provider deals to this wholesale mid-market rate. Read more
USD
 
-0.5%
14d-lows
 
Track Rate

View My Rate Tracker


Compare & Save on Exchange Rates

Exchange rates can vary significantly between banks and currency exchange providers, so it's important to compare rates from different sources before making a conversion.

The below table makes it easy to calculate and compare the Total Cost you are being charged on currency rates and the possible savings of using a foreign exchange provider rather than your bank.


Loading exchange rates...


Top GBP Rates


British pound to US dollar
GBPUSD 90 day chart

GBP to USD is at 14-day lows near 1.3427, near its 3-month average, having traded in a quite stable 4.3% range from 1.3176 to 1.3746
GBP to USD
1.3382
-0.5%
14d-lows

British pound to Euro
GBPEUR 90 day chart

GBP to EUR is at 90-day lows near 1.1510, 2.0% below its 3-month average of 1.1748, having traded in a very stable 3.6% range from 1.1510 to 1.1928
GBP to EUR
1.1535
-0.4%
90d-lows

British pound to Australian dollar
GBPAUD 90 day chart

GBP to AUD is at 90-day lows near 2.0515, 1.3% below its 3-month average of 2.0795, having traded in a very stable 2.4% range from 2.0515 to 2.1011
GBP to AUD
2.0546
-0.2%
90d-lows

British pound to Canadian dollar
GBPCAD 90 day chart

GBP to CAD is at 14-day lows near 1.8402, just 0.6% below its 3-month average of 1.8517, having traded in a very stable 2.8% range from 1.8305 to 1.8814
GBP to CAD
1.8367
-0.4%
14d-lows

British pound to Indian rupee
GBPINR 90 day chart

GBP to INR is at 30-day lows near 115.4, just above its 3-month average, having traded in a quite stable 5.2% range from 111.9 to 117.7
GBP to INR
115.09
-0.3%
30d-lows

British pound to Turkish lira
GBPTRY 90 day chart

GBP to TRY at 54.03 is 2.6% above its 3-month average of 52.65, having traded in a fairly volatile 8.7% range from 50.40 to 54.76
GBP to TRY
53.83
-0.3%

British pound to United Arab Emirates dirham
GBPAED 90 day chart

GBP to AED is at 14-day lows near 4.9316, near its 3-month average, having traded in a quite stable 4.3% range from 4.8395 to 5.0490
GBP to AED
4.9154
-0.5%
14d-lows

British pound to New Zealand dollar
GBPNZD 90 day chart

GBP to NZD at 2.2483 is near its 3-month average, having traded in a very stable 2.4% range from 2.2206 to 2.2749
GBP to NZD
2.2522

British pound to Malaysian ringgit
GBPMYR 90 day chart

GBP to MYR is at 14-day lows near 5.7097, just 0.7% below its 3-month average of 5.7491, having traded in a quite stable 4.9% range from 5.5913 to 5.8653
GBP to MYR
5.6775
-0.5%
14d-lows

British pound to South African rand
GBPZAR 90 day chart

GBP to ZAR is at 7-day lows near 24.04, 1.1% below its 3-month average of 24.32, having traded in a quite stable 5.4% range from 23.90 to 25.19
GBP to ZAR
23.99
-0.5%

A-Z


British pound to Australian dollar
GBPAUD 90 day chart

GBP to AUD is at 90-day lows near 2.0515, 1.3% below its 3-month average of 2.0795, having traded in a very stable 2.4% range from 2.0515 to 2.1011
GBP to AUD
2.0546
-0.2%
90d-lows

British pound to Brazilian real
GBPBRL 90 day chart

GBP to BRL at 7.5049 is just 0.6% below its 3-month average of 7.549, having traded in a quite stable 5.6% range from 7.3740 to 7.7878
GBP to BRL
7.4398

British pound to Canadian dollar
GBPCAD 90 day chart

GBP to CAD is at 14-day lows near 1.8402, just 0.6% below its 3-month average of 1.8517, having traded in a very stable 2.8% range from 1.8305 to 1.8814
GBP to CAD
1.8367
-0.4%
14d-lows

British pound to Swiss franc
GBPCHF 90 day chart

GBP to CHF is at 90-day lows near 1.0714, 2.5% below its 3-month average of 1.0992, having traded in a quite stable 4.3% range from 1.0714 to 1.1176
GBP to CHF
1.0731
-0.4%
90d-lows

British pound to Chilean peso
GBP to CLP at 1301 is 2.6% above its 3-month average of 1268, having traded in a quite stable 5.0% range from 1240 to 1302
GBP to CLP
1,294.6
+0.8%
90d-highs

British pound to Chinese yuan
GBPCNY 90 day chart

GBP to CNY is at 14-day lows near 9.6242, just 0.8% below its 3-month average of 9.702, having traded in a very stable 3.8% range from 9.4910 to 9.8495
GBP to CNY
9.5992
-0.5%
14d-lows

British pound to Czech Republic horuna
GBPCZK 90 day chart

GBP to CZK is at 90-day lows near 28.39, 2.7% below its 3-month average of 29.19, having traded in a quite stable 4.8% range from 28.39 to 29.74
GBP to CZK
28.46
-0.5%
90d-lows

British pound to Danish krone
GBPDKK 90 day chart

GBP to DKK is at 90-day lows near 8.5907, 2.0% below its 3-month average of 8.7658, having traded in a very stable 3.6% range from 8.5907 to 8.8960
GBP to DKK
8.6094
-0.5%
90d-lows

British pound to Euro
GBPEUR 90 day chart

GBP to EUR is at 90-day lows near 1.1510, 2.0% below its 3-month average of 1.1748, having traded in a very stable 3.6% range from 1.1510 to 1.1928
GBP to EUR
1.1535
-0.4%
90d-lows

British pound to Hong Kong dollar
GBPHKD 90 day chart

GBP to HKD is at 14-day lows near 10.54, just above its 3-month average, having traded in a quite stable 5.1% range from 10.27 to 10.79
GBP to HKD
10.51
-0.5%
14d-lows

British pound to Hungarian forint
GBP to HUF is at 90-day lows near 460.3, 2.8% below its 3-month average of 473.5, having traded in a quite stable 4.6% range from 460.3 to 481.7
GBP to HUF
462.11
-0.6%
90d-lows

British pound to Indonesian rupiah
GBPIDR 90 day chart

GBP to IDR is at 90-day lows near 21843, 1.1% below its 3-month average of 22092, having traded in a very stable 3.4% range from 21843 to 22588
GBP to IDR
21,775
-0.2%
90d-lows

British pound to Israeli new sheqel
GBPILS 90 day chart

GBP to ILS at 4.5096 is 4.7% below its 3-month average of 4.7296, having traded in a quite volatile 10.4% range from 4.4964 to 4.9619
GBP to ILS
4.5058
+0.2%
90d-lows

British pound to Indian rupee
GBPINR 90 day chart

GBP to INR is at 30-day lows near 115.4, just above its 3-month average, having traded in a quite stable 5.2% range from 111.9 to 117.7
GBP to INR
115.09
-0.3%
30d-lows

British pound to Japanese yen
GBPJPY 90 day chart

GBP to JPY at 198.4 is 2.0% above its 3-month average of 194.5, having traded in a quite stable 6.0% range from 187.9 to 199.2
GBP to JPY
199.21
-0.1%

British pound to Mexican peso
GBPMXN 90 day chart

GBP to MXN at 25.17 is 2.6% below its 3-month average of 25.85, having traded in a quite stable 5.8% range from 25.15 to 26.60
GBP to MXN
25.19
+0.1%

British pound to Malaysian ringgit
GBPMYR 90 day chart

GBP to MYR is at 14-day lows near 5.7097, just 0.7% below its 3-month average of 5.7491, having traded in a quite stable 4.9% range from 5.5913 to 5.8653
GBP to MYR
5.6775
-0.5%
14d-lows

British pound to Norwegian krone
GBPNOK 90 day chart

GBP to NOK is at 14-day lows near 13.62, just 0.9% below its 3-month average of 13.74, having traded in a quite stable 5.5% range from 13.35 to 14.08
GBP to NOK
13.73
-0.4%
14d-lows

British pound to New Zealand dollar
GBPNZD 90 day chart

GBP to NZD at 2.2483 is near its 3-month average, having traded in a very stable 2.4% range from 2.2206 to 2.2749
GBP to NZD
2.2522

British pound to Omani rial
GBP to OMR is at 14-day lows near 0.5163, just below its 3-month average, having traded in a quite stable 4.2% range from 0.5073 to 0.5285
GBP to OMR
0.5146
-0.5%
14d-lows

British pound to Philippine peso
GBPPHP 90 day chart

GBP to PHP is at 30-day lows near 76.07, just 0.7% above its 3-month average of 75.54, having traded in a quite stable 5.8% range from 73.45 to 77.72
GBP to PHP
76.07
-0.1%
30d-lows

British pound to Pakistani rupee
GBPPKR 90 day chart

GBP to PKR is at 14-day lows near 382.2, just 0.6% above its 3-month average of 380, having traded in a quite stable 5.8% range from 370.2 to 391.5
GBP to PKR
380.93
-0.4%
14d-lows

British pound to Polish zloty
GBPPLN 90 day chart

GBP to PLN at 4.8994 is 2.1% below its 3-month average of 5.0032, having traded in a relatively stable 7.9% range from 4.7144 to 5.0890
GBP to PLN
4.9203
-0.7%

British pound to Qatari rial
GBP to QAR is at 14-day lows near 4.8895, just below its 3-month average, having traded in a quite stable 4.3% range from 4.7986 to 5.0033
GBP to QAR
4.8720
-0.4%
14d-lows

British pound to Russian ruble
GBPRUB 90 day chart

GBP to RUB at 104.9 is 2.3% below its 3-month average of 107.4, having traded in a fairly volatile 8.6% range from 102.3 to 111.1
GBP to RUB
104.48
-0.7%

British pound to Saudi riyal
GBPSAR 90 day chart

GBP to SAR is at 14-day lows near 5.0357, near its 3-month average, having traded in a quite stable 4.3% range from 4.9419 to 5.1550
GBP to SAR
5.0192
-0.5%
14d-lows

British pound to Swedish krona
GBPSEK 90 day chart

GBP to SEK at 12.92 is near its 3-month average, having traded in a very stable 2.7% range from 12.75 to 13.09
GBP to SEK
13.02
-0.1%

British pound to Singapore dollar
GBPSGD 90 day chart

GBP to SGD is at 60-day lows near 1.7216, just 0.8% below its 3-month average of 1.7369, having traded in a very stable 2.5% range from 1.7155 to 1.7591
GBP to SGD
1.7198
-0.4%
60d-lows

British pound to Thai baht
GBPTHB 90 day chart

GBP to THB is at 90-day lows near 43.60, 1.3% below its 3-month average of 44.17, having traded in a very stable 3.0% range from 43.60 to 44.89
GBP to THB
43.63
-0.5%
90d-lows

British pound to Turkish lira
GBPTRY 90 day chart

GBP to TRY at 54.03 is 2.6% above its 3-month average of 52.65, having traded in a fairly volatile 8.7% range from 50.40 to 54.76
GBP to TRY
53.83
-0.3%

British pound to New Taiwan dollar
GBP to TWD is at 60-day lows near 39.43, 3.0% below its 3-month average of 40.66, having traded in a rather volatile 12.4% range from 38.80 to 43.61
GBP to TWD
39.34
-0.1%
60d-lows

British pound to US dollar
GBPUSD 90 day chart

GBP to USD is at 14-day lows near 1.3427, near its 3-month average, having traded in a quite stable 4.3% range from 1.3176 to 1.3746
GBP to USD
1.3382
-0.5%
14d-lows

British pound to Vietnamese dong
GBPVND 90 day chart

GBP to VND is at 14-day lows near 35070, near its 3-month average, having traded in a quite stable 5.1% range from 34168 to 35919
GBP to VND
34,978
-0.4%
14d-lows

British pound to Samoan tala
GBP to WST is at 14-day lows near 3.7595, near its 3-month average, having traded in a quite stable 4.3% range from 3.6893 to 3.8489
GBP to WST
3.7471
-0.5%
14d-lows

British pound to Central African franc
GBP to XAF is at 90-day lows near 755.0, 2.0% below its 3-month average of 770.6, having traded in a very stable 3.6% range from 755.0 to 782.5
GBP to XAF
756.66
-0.4%
90d-lows

British pound to East Caribbean dollar
GBPXCD 90 day chart

GBP to XCD is at 14-day lows near 3.6286, near its 3-month average, having traded in a quite stable 4.4% range from 3.5575 to 3.7150
GBP to XCD
3.6167
-0.5%
14d-lows

British pound to West African franc
GBP to XOF is at 90-day lows near 755.0, 2.0% below its 3-month average of 770.6, having traded in a very stable 3.6% range from 755.0 to 782.5
GBP to XOF
756.66
-0.4%
90d-lows

British pound to South African rand
GBPZAR 90 day chart

GBP to ZAR is at 7-day lows near 24.04, 1.1% below its 3-month average of 24.32, having traded in a quite stable 5.4% range from 23.90 to 25.19
GBP to ZAR
23.99
-0.5%