Switch .com Best Exchange Rates .com Best Exchange Rates .com Best Exchange Rates
BER

British pound Markets

GBP Currency Update - Our review of British pound forecasts and news plus charts and historic rates. Check GBP Trends over various time periods.


The British pound (GBP) began the week under pressure, despite positive GDP data revealing that the UK was the fastest-growing economy in the G7 during the first quarter. This optimism was tempered by concerns over falling real household disposable income per head, marking its first quarterly decline in nearly two years. Analysts note that this decline could undermine consumer confidence, potentially impacting economic recovery.

Additionally, GBP investors are keenly awaiting comments from Bank of England (BoE) Governor Andrew Bailey at the European Central Bank's annual Sintra forum, with any insights into future monetary policy likely to influence market sentiment further.

Recent geopolitical developments have also impacted sterling's value. The imposition of a 10% tariff by the US on UK goods, linked to ongoing trade tensions, could threaten trade flows and further complicate the UK’s post-Brexit position in international markets.

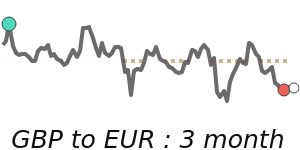
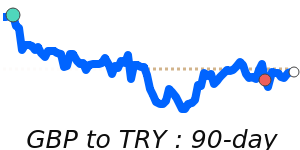
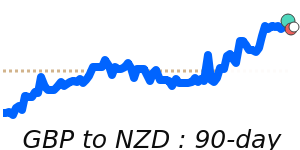
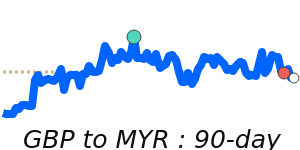
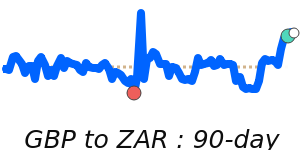
In the context of currency pairs, the GBP/USD is currently trading at 90-day highs of approximately 1.3735, significantly above its three-month average of 1.3363, and within a stable range. In contrast, the GBP/EUR is facing challenges, reaching 60-day lows around 1.1650, reflecting a slight decline from its three-month average of 1.1770. The GBP/JPY pair, meanwhile, is performing robustly, at 197.4, exceeding its average, indicating some strength against the Japanese yen.

Experts emphasize that movements in the GBP are heavily influenced by domestic economic indicators and political stability, alongside international market sentiment. Given the ongoing economic transformation and the potential effects of the BoE's monetary policies, the outlook for the pound remains dynamic, with eyes on further economic data and geopolitical developments that may sway its trajectory in the near term.


British pound to US dollar - GBP/USD Trend

 
GBP to USD is at 90-day highs near 1.3735, 2.8% above its 3-month average of 1.3363, having traded in a relatively stable 7.9% range from 1.2725 to 1.3735
|
 
1 GBP =
1.3743We compare provider deals to this wholesale mid-market rate. Read more
USD
 
+0.2%
90d-highs
 
Track Rate

View My Rate Tracker


Compare & Save on Exchange Rates

Exchange rates can vary significantly between banks and currency exchange providers, so it's important to compare rates from different sources before making a conversion.

The below table makes it easy to calculate and compare the Total Cost you are being charged on currency rates and the possible savings of using a foreign exchange provider rather than your bank.


Loading exchange rates...


Top GBP Rates


British pound to US dollar
GBPUSD 90 day chart

GBP to USD is at 90-day highs near 1.3735, 2.8% above its 3-month average of 1.3363, having traded in a relatively stable 7.9% range from 1.2725 to 1.3735
GBP to USD
1.3743
+0.2%
90d-highs

British pound to Euro
GBPEUR 90 day chart

GBP to EUR is at 60-day lows near 1.1650, 1.0% below its 3-month average of 1.177, having traded in a very stable 4.0% range from 1.1517 to 1.1979
GBP to EUR
1.1644
-0.3%
60d-lows

British pound to Australian dollar
GBPAUD 90 day chart

GBP to AUD at 2.0883 is just above its 3-month average, having traded in a quite stable 4.3% range from 2.0553 to 2.1430
GBP to AUD
2.0890
-0.4%

British pound to Canadian dollar
GBPCAD 90 day chart

GBP to CAD at 1.8686 is 1.1% above its 3-month average of 1.848, having traded in a quite stable 4.2% range from 1.8062 to 1.8814
GBP to CAD
1.8756
-0.4%

British pound to Indian rupee
GBPINR 90 day chart

GBP to INR is at 90-day highs near 117.7, 2.9% above its 3-month average of 114.4, having traded in a relatively stable 7.6% range from 109.4 to 117.7
GBP to INR
117.68
+0.4%
90d-highs

British pound to Turkish lira
GBPTRY 90 day chart

GBP to TRY at 54.71 is 5.4% above its 3-month average of 51.89, having traded in a rather volatile 13.3% range from 48.34 to 54.76
GBP to TRY
54.76
+0.1%

British pound to United Arab Emirates dirham
GBPAED 90 day chart

GBP to AED is at 90-day highs near 5.0441, 2.8% above its 3-month average of 4.908, having traded in a relatively stable 7.9% range from 4.6737 to 5.0441
GBP to AED
5.0479
+0.2%
90d-highs

British pound to New Zealand dollar
GBPNZD 90 day chart

GBP to NZD at 2.2543 is near its 3-month average, having traded in a very stable 3.9% range from 2.2206 to 2.3066
GBP to NZD
2.2534
-0.4%

British pound to Malaysian ringgit
GBPMYR 90 day chart

GBP to MYR is at 7-day lows near 5.7754, just above its 3-month average, having traded in a quite stable 4.9% range from 5.5913 to 5.8653
GBP to MYR
5.7687
-0.3%

British pound to South African rand
GBPZAR 90 day chart

GBP to ZAR at 24.33 is just below its 3-month average, having traded in a quite stable 5.7% range from 23.88 to 25.25
GBP to ZAR
24.21
-0.7%

A-Z


British pound to Australian dollar
GBPAUD 90 day chart

GBP to AUD at 2.0883 is just above its 3-month average, having traded in a quite stable 4.3% range from 2.0553 to 2.1430
GBP to AUD
2.0890
-0.4%

British pound to Brazilian real
GBPBRL 90 day chart

GBP to BRL at 7.4620 is 1.3% below its 3-month average of 7.5615, having traded in a quite stable 6.0% range from 7.3466 to 7.7878
GBP to BRL
7.5013
-0.7%

British pound to Canadian dollar
GBPCAD 90 day chart

GBP to CAD at 1.8686 is 1.1% above its 3-month average of 1.848, having traded in a quite stable 4.2% range from 1.8062 to 1.8814
GBP to CAD
1.8756
-0.4%

British pound to Swiss franc
GBPCHF 90 day chart

GBP to CHF is at 60-day lows near 1.0884, 1.2% below its 3-month average of 1.102, having traded in a relatively stable 7.6% range from 1.0655 to 1.1468
GBP to CHF
1.0872
-0.7%
60d-lows

British pound to Chilean peso
GBP to CLP at 1280 is 1.2% above its 3-month average of 1265, having traded in a quite stable 5.3% range from 1224 to 1289
GBP to CLP
1,276.2
+0.3%

British pound to Chinese yuan
GBPCNY 90 day chart

GBP to CNY is at 90-day highs near 9.8414, 1.8% above its 3-month average of 9.6637, having traded in a quite stable 5.8% range from 9.3032 to 9.8414
GBP to CNY
9.8474
+0.1%
90d-highs

British pound to Czech Republic horuna
GBPCZK 90 day chart

GBP to CZK is at 90-day lows near 28.81, 1.7% below its 3-month average of 29.33, having traded in a very stable 3.8% range from 28.81 to 29.90
GBP to CZK
28.74
-0.3%
90d-lows

British pound to Danish krone
GBPDKK 90 day chart

GBP to DKK is at 60-day lows near 8.6916, 1.0% below its 3-month average of 8.7826, having traded in a very stable 3.9% range from 8.5991 to 8.9351
GBP to DKK
8.6875
-0.3%
60d-lows

British pound to Euro
GBPEUR 90 day chart

GBP to EUR is at 60-day lows near 1.1650, 1.0% below its 3-month average of 1.177, having traded in a very stable 4.0% range from 1.1517 to 1.1979
GBP to EUR
1.1644
-0.3%
60d-lows

British pound to Hong Kong dollar
GBPHKD 90 day chart

GBP to HKD is at 90-day highs near 10.78, 3.4% above its 3-month average of 10.43, having traded in a fairly volatile 9.1% range from 9.8844 to 10.78
GBP to HKD
10.79
+0.2%
90d-highs

British pound to Hungarian forint
GBP to HUF is at 90-day lows near 465.3, 2.1% below its 3-month average of 475.5, having traded in a very stable 3.5% range from 465.3 to 481.7
GBP to HUF
464.98
-0.1%
90d-lows

British pound to Indonesian rupiah
GBPIDR 90 day chart

GBP to IDR at 22230 is just 0.8% above its 3-month average of 22055, having traded in a quite stable 5.2% range from 21462 to 22588
GBP to IDR
22,224
60d-highs

British pound to Israeli new sheqel
GBPILS 90 day chart

GBP to ILS is at 90-day lows near 4.6239, 3.2% below its 3-month average of 4.7761, having traded in a relatively stable 7.3% range from 4.6239 to 4.9619
GBP to ILS
4.6495
-0.3%
90d-lows

British pound to Indian rupee
GBPINR 90 day chart

GBP to INR is at 90-day highs near 117.7, 2.9% above its 3-month average of 114.4, having traded in a relatively stable 7.6% range from 109.4 to 117.7
GBP to INR
117.68
+0.4%
90d-highs

British pound to Japanese yen
GBPJPY 90 day chart

GBP to JPY at 197.4 is 2.2% above its 3-month average of 193.1, having traded in a relatively stable 6.3% range from 186.7 to 198.5
GBP to JPY
197.12
-0.2%

British pound to Mexican peso
GBPMXN 90 day chart

GBP to MXN is at 7-day lows near 25.75, 1.0% below its 3-month average of 26.02, having traded in a quite stable 4.3% range from 25.52 to 26.61
GBP to MXN
25.76
-0.2%

British pound to Malaysian ringgit
GBPMYR 90 day chart

GBP to MYR is at 7-day lows near 5.7754, just above its 3-month average, having traded in a quite stable 4.9% range from 5.5913 to 5.8653
GBP to MYR
5.7687
-0.3%

British pound to Norwegian krone
GBPNOK 90 day chart

GBP to NOK is at 30-day highs near 13.84, just 0.6% above its 3-month average of 13.76, having traded in a quite stable 5.5% range from 13.35 to 14.08
GBP to NOK
13.84
+0.4%
30d-highs

British pound to New Zealand dollar
GBPNZD 90 day chart

GBP to NZD at 2.2543 is near its 3-month average, having traded in a very stable 3.9% range from 2.2206 to 2.3066
GBP to NZD
2.2534
-0.4%

British pound to Omani rial
GBP to OMR is at 90-day highs near 0.5281, 2.7% above its 3-month average of 0.5141, having traded in a relatively stable 7.8% range from 0.4898 to 0.5281
GBP to OMR
0.5284
+0.6%
90d-highs

British pound to Philippine peso
GBPPHP 90 day chart

GBP to PHP at 77.35 is 2.9% above its 3-month average of 75.17, having traded in a relatively stable 6.5% range from 73.00 to 77.72
GBP to PHP
77.37
-0.2%

British pound to Pakistani rupee
GBPPKR 90 day chart

GBP to PKR at 389.7 is 3.5% above its 3-month average of 376.7, having traded in a fairly volatile 9.7% range from 356.9 to 391.5
GBP to PKR
390.00
+0.3%
90d-highs

British pound to Polish zloty
GBPPLN 90 day chart

GBP to PLN is at 60-day lows near 4.9445, 1.4% below its 3-month average of 5.0129, having traded in a relatively stable 7.9% range from 4.7144 to 5.0890
GBP to PLN
4.9485
-0.1%
60d-lows

British pound to Qatari rial
GBP to QAR is at 90-day highs near 5.0014, 2.7% above its 3-month average of 4.8692, having traded in a relatively stable 7.8% range from 4.6404 to 5.0014
GBP to QAR
5.0022
+0.3%
90d-highs

British pound to Russian ruble
GBPRUB 90 day chart

GBP to RUB at 107.4 is just below its 3-month average, having traded in a relatively stable 6.9% range from 103.9 to 111.1
GBP to RUB
107.86
-0.3%

British pound to Saudi riyal
GBPSAR 90 day chart

GBP to SAR is at 90-day highs near 5.1511, 2.8% above its 3-month average of 5.0129, having traded in a relatively stable 7.8% range from 4.7780 to 5.1511
GBP to SAR
5.1536
+0.2%
90d-highs

British pound to Swedish krona
GBPSEK 90 day chart

GBP to SEK at 12.98 is just 0.5% above its 3-month average of 12.91, having traded in a very stable 2.5% range from 12.75 to 13.07
GBP to SEK
13.03
-0.2%

British pound to Singapore dollar
GBPSGD 90 day chart

GBP to SGD at 1.7455 is just 0.5% above its 3-month average of 1.7366, having traded in a very stable 2.5% range from 1.7155 to 1.7591
GBP to SGD
1.7492
-0.2%
60d-highs

British pound to Thai baht
GBPTHB 90 day chart

GBP to THB at 44.55 is just 0.8% above its 3-month average of 44.2, having traded in a very stable 2.9% range from 43.64 to 44.89
GBP to THB
44.61
-0.3%
60d-highs

British pound to Turkish lira
GBPTRY 90 day chart

GBP to TRY at 54.71 is 5.4% above its 3-month average of 51.89, having traded in a rather volatile 13.3% range from 48.34 to 54.76
GBP to TRY
54.76
+0.1%

British pound to New Taiwan dollar
GBP to TWD at 40.13 is 2.4% below its 3-month average of 41.12, having traded in a rather volatile 12.4% range from 38.80 to 43.61
GBP to TWD
40.19
+0.6%

British pound to US dollar
GBPUSD 90 day chart

GBP to USD is at 90-day highs near 1.3735, 2.8% above its 3-month average of 1.3363, having traded in a relatively stable 7.9% range from 1.2725 to 1.3735
GBP to USD
1.3743
+0.2%
90d-highs

British pound to Vietnamese dong
GBPVND 90 day chart

GBP to VND is at 90-day highs near 35874, 3.3% above its 3-month average of 34718, having traded in a fairly volatile 9.2% range from 32838 to 35874
GBP to VND
35,911
+0.3%
90d-highs

British pound to Samoan tala
GBP to WST is at 90-day highs near 3.8457, 2.8% above its 3-month average of 3.7416, having traded in a relatively stable 7.9% range from 3.5629 to 3.8457
GBP to WST
3.8481
+0.2%
90d-highs

British pound to Central African franc
GBP to XAF is at 60-day lows near 764.2, 1.0% below its 3-month average of 772, having traded in a very stable 4.0% range from 755.5 to 785.8
GBP to XAF
763.77
-0.3%
60d-lows

British pound to East Caribbean dollar
GBPXCD 90 day chart

GBP to XCD is at 90-day highs near 3.7118, 2.8% above its 3-month average of 3.6105, having traded in a relatively stable 7.9% range from 3.4389 to 3.7118
GBP to XCD
3.7142
+0.2%
90d-highs

British pound to West African franc
GBP to XOF is at 60-day lows near 764.2, 1.0% below its 3-month average of 772, having traded in a very stable 4.0% range from 755.5 to 785.8
GBP to XOF
763.77
-0.3%
60d-lows

British pound to South African rand
GBPZAR 90 day chart

GBP to ZAR at 24.33 is just below its 3-month average, having traded in a quite stable 5.7% range from 23.88 to 25.25
GBP to ZAR
24.21
-0.7%