The British pound (GBP) has demonstrated a slight ascent despite recent mixed jobs data from the UK, which indicated an uptick in unemployment and a deceleration in wage growth for June. Analysts noted that the upward revision of May’s payroll figures—from a loss of 109,000 jobs to a loss of only 25,000—helped alleviate some concerns regarding potential dovish monetary policy adjustments from the Bank of England (BoE). However, market sentiment suggests that the pound may face challenges in sustaining its current strength due to a lack of significant economic data forthcoming, leading its direction to be influenced by broader market trends.
In the broader economic landscape, the GBP's value remains sensitive to domestic indicators, such as inflation levels and employment statistics, which are pivotal in guiding the BoE's monetary policy decisions. Notably, geopolitical factors including the recent imposition of a 10% reciprocal tariff by the United States on British goods, as part of a broader trade strategy, introduce additional volatility and uncertainty, especially given the ongoing implications of Brexit.
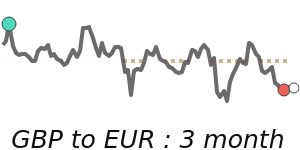
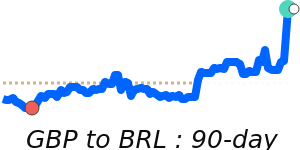
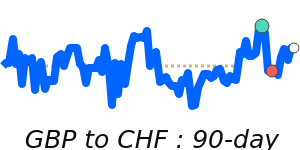
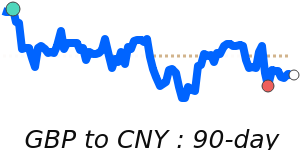
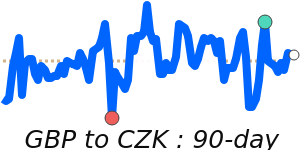
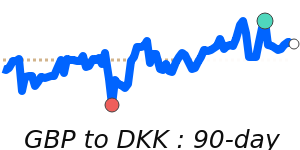
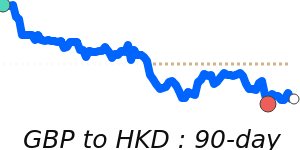
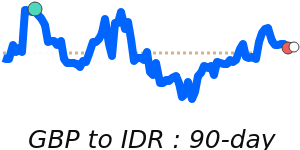
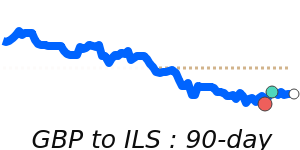
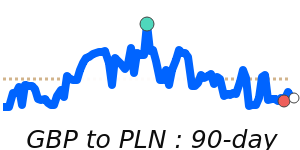
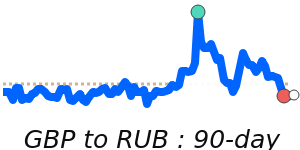
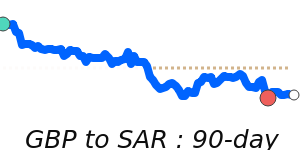
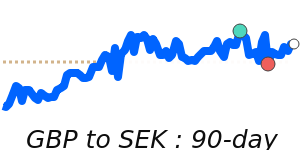
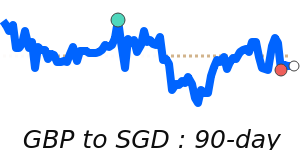
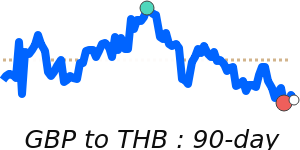
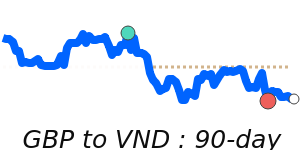
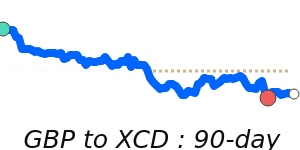
GBP/USD is presently quoted at 1.3432, just below its three-month average, navigating within a stable range of 1.3176 to 1.3746. Meanwhile, GBP/EUR is trading at 1.1563, reflecting a 1.5% decline from its three-month average of 1.1745, trading within a tighter 3.6% range of 1.1510 to 1.1928. In contrast, GBP/JPY shows stronger performance at 199.3, exceeding its three-month average by 2.3%, with a trading range from 188.5 to 199.4.
Moving forward, the trajectory of the pound hinges on the UK’s economic recovery, the actions of the BoE, and broader trade agreements. With the UK aiming to bolster its position in global trade post-Brexit, a focus on foreign investment and economic reforms will be crucial. Observers will continue to monitor these elements closely, coupled with market dynamics, to gauge the future outlook for the GBP.