Latest market analysis
INR Market Update
01 Aug 2026 • 01:10 GMT
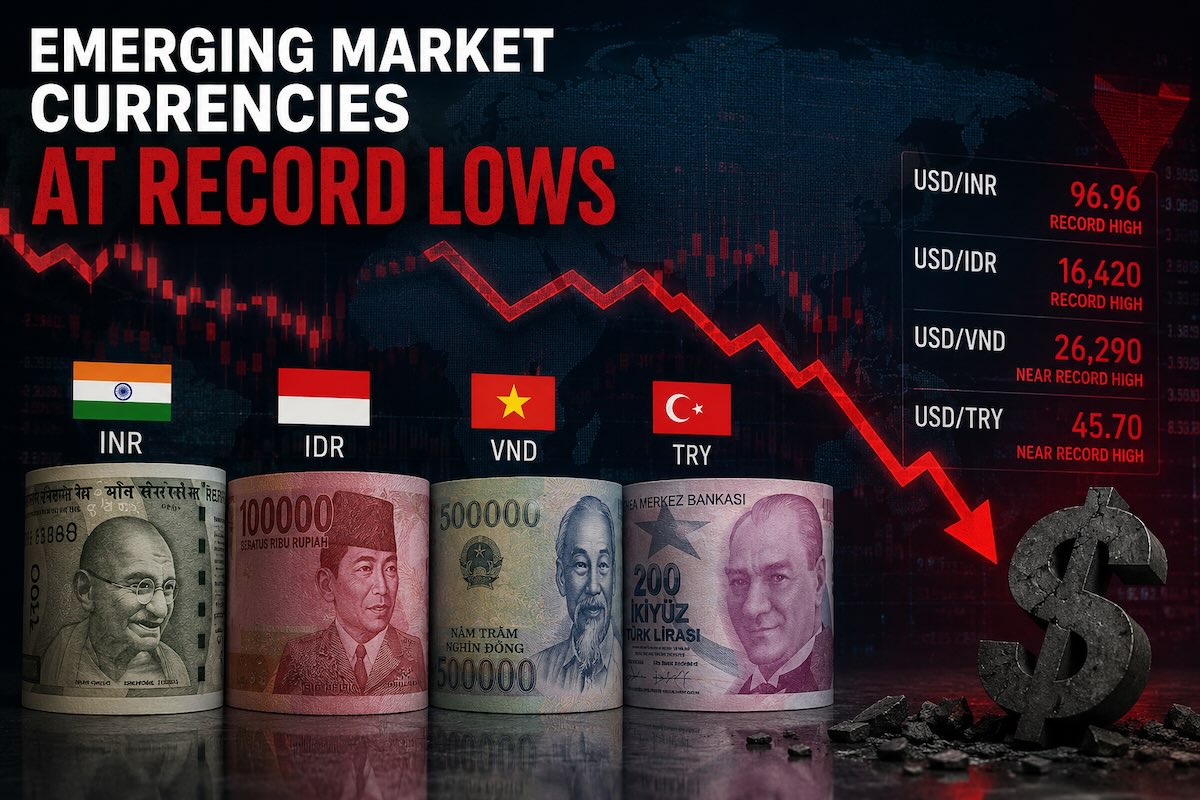
The Indian Rupee (INR) remains near 14-day highs against the US dollar, trading close to 0.010482, which is around its 3-month average. The INR has been relatively stable in a narrow 2.8% range from 0.010326 to 0.010610. However, recent US dollar strength as markets anticipate a hawkish Federal Reserve could weigh on emerging market currencies like the INR.
External factors are influencing the Rupee’s outlook. Rising oil prices due to geopolitical tensions in the Middle East are increasing India's import costs and putting downward pressure on the INR. Additionally, foreign portfolio outflows from Indian equities continue to add to USD demand. The Reserve Bank of India's flexible approach allows some currency adjustment, but sustained external pressures may keep tensions in the foreign exchange markets.
Looking ahead, the USD's recent rally and potential policy signals from the Fed suggest the INR may face some headwinds. Longer-term forecasts from major banks are divided, with some expecting the USDINR pair to dip below 93 by year-end, while others see more vulnerability to oil shocks that could push the pair higher. So, continued vigilance on oil prices and US monetary policy will be key for the Indian currency.
Forecast snapshot
Quick INR/USD forecast
Near-term bias⚪ Range-bound
Expected range0.0100 – 0.0110
Dominant driver🏦 Central bank policy divergence
3-month trend🔴 Downtrend
Stay informed
INR news & insights
Recent analysis, guides and market developments relevant to the Indian rupee.


Rate direction
US dollar to Indian rupee · USD/INR trend
Review the recent market direction, current mid-market rate and significant movement alerts.
Compare before you exchange
Compare and save on INR exchange rates
Exchange rates vary between banks and currency providers. Use the comparison below to understand total costs and potential savings against typical bank pricing.
Loading exchange rates...
|
|
|
||
|
|
|
||
|
|
|
||
|
|
|