INR Market Update
24 Jul 2026 • 00:32 GMT
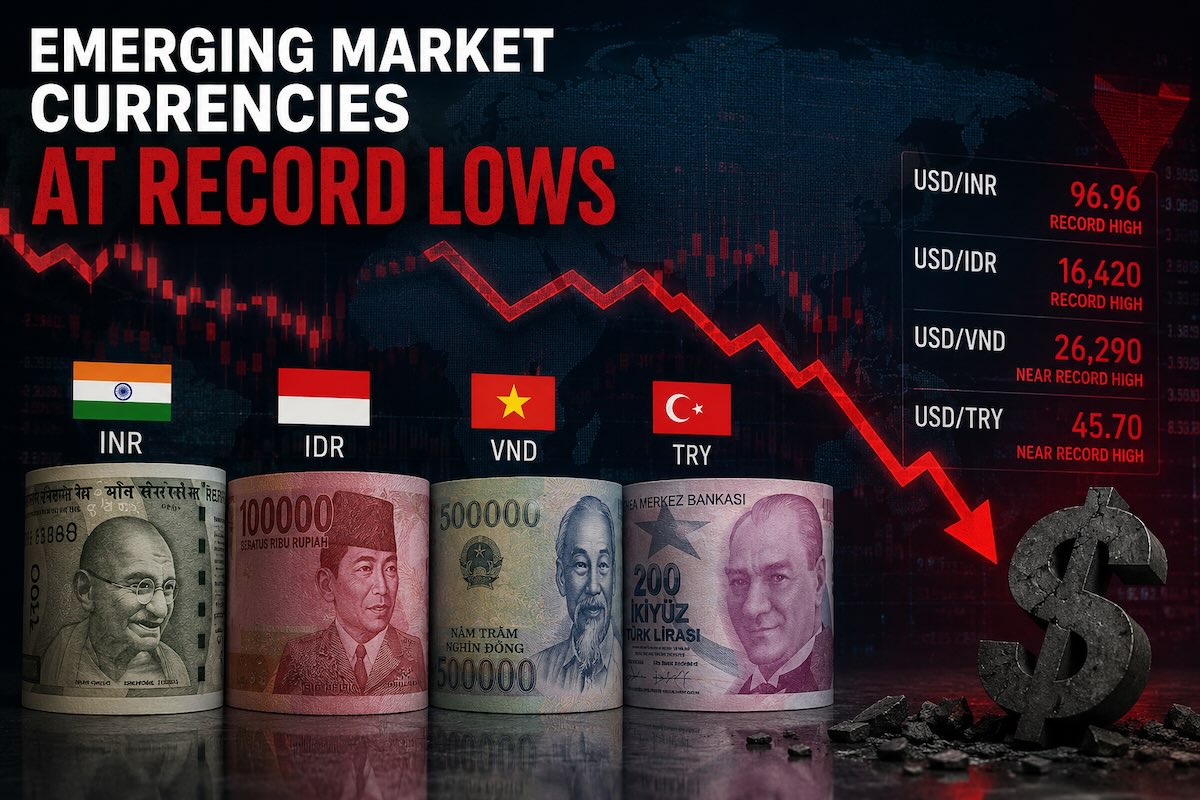
The Indian Rupee (INR) has recently weakened to its 90-day lows against the US dollar, trading near 0.010322. This represents about a 1.6% decline from its three-month average, amid ongoing global uncertainties. Elevated oil prices, driven by rising tensions in the Middle East, continue to pressure India's import bills and current account. Moreover, significant foreign fund outflows from Indian equities have added to dollar demand, making it harder for the Rupee to maintain strength.
The Reserve Bank of India has been flexible, allowing the currency to slip to help manage these external pressures. While the rupee remains within a stable range of about 3%, the overall downward trend reflects broader concerns over capital flows and oil prices. Longer-term forecasts suggest the Rupee could weaken further by the end of the year, especially if oil prices stay high or geopolitical tensions escalate.
For now, traders should keep an eye on oil price movements and global risk factors, as these areas are likely to have the biggest influence on the INR’s near-term path. The currency continues to trade in a stable pattern but remains vulnerable to external shocks.
📊 Quick forecast view
🟢 Mild upside
0.0100 – 0.0110
🌍 Global risk sentiment