The comparison table above helps you see the total cost of your currency transaction by showing the exchange rates offered by different providers. It also makes it easy to spot potential savings from market-leading FX services compared to bank rates.
To see a full list of available providers, simply enter your transaction type, details and click ‘GET RATES’.
USD to EUR Market Data
US dollar (USD) to Euro (EUR) market data - latest interbank exchange rate, trend, chart & historic rates.
USD to EUR is at 14-day highs near 0.8546, 2.3% below its 3-month average of 0.8744, having traded in a relatively stable 6.5% range from 0.8470 to 0.9019
Is the USD to EUR Exchange Rate Likely to Improve?
Predicting exchange rate movements is always challenging, as they’re influenced by a wide range of economic and geopolitical factors. One useful way to assess the current value of the US dollar against the Euro is to review how the USD/EUR rate has changed over time.
The table below shows the percentage change in the USD to EUR exchange rate across various timeframes—from the past 2 weeks to the last 20 years:
Date
USD/EUR
Change
Period
27 Jun 2025
0.8532
0.3% ▲
2 Week
12 Apr 2025
0.8804
2.8% ▼
3 Month
11 Jul 2024
0.9196
6.9% ▼
1 Year
12 Jul 2020
0.8843
3.2% ▼
5 Year
14 Jul 2015
0.9080
5.7% ▼
10 Year
16 Jul 2005
0.8293
3.2% ▲
20 Year
USD/EUR historic rates & change to 11-Jul-2025
As of July 11, 2025, the USD/EUR is trading at 0.8546, buoyed by safe-haven flows amid trade deal speculation. However, increasing EU uncertainties and poor Eurozone retail sales weigh on the euro. Analysts highlight key factors to watch: oil prices, Fed policy, & ECB decisions
@bestfxrates
USD to EUR Conversion: What Is Your Money Worth?
To help you understand the real-world value of the current exchange rate, the table below shows how much US dollar are worth in Euro across a range of amounts.
This gives a quick view of what you’d get when converting different USD amounts at today’s rate * :
This is always a difficult question as exchange rates are influenced by many factors, so a good method to consider the Euro current value is to look the EUR performance against a range of other currencies over various time periods.
The following table looks at the performance of the EUR exchange rate against selections of other currencies over time periods from the previous 2 days back to the last 5 years.
Popular Rates (A - Z)
United Arab Emirates dirham to Indian rupee
AED to INR at 23.34 is near its 3-month average, having traded in a very stable 3.0% range from 22.93 to 23.61
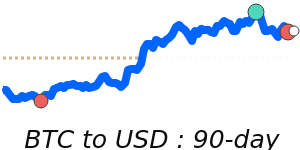
BTC to USD is at 90-day highs near 116061, 13.9% above its 3-month average of 101942, having traded in a highly volatile 39.0% range from 83474 to 116061
EUR to USD is at 14-day lows near 1.1701, 2.3% above its 3-month average of 1.1439, having traded in a relatively stable 6.5% range from 1.1087 to 1.1807