US dollar (USD) Market Update
Currency Market Update: US Dollar (USD)
The US dollar (USD) has recently experienced downward pressure as a shift towards risk-on sentiment encourages investors to sell off safe-haven assets. This trend was exacerbated by disappointing economic data, particularly a significant decline in the New York state manufacturing index, which has reached its lowest point since March. Analysts noted that this marks the fourth consecutive decline in business conditions, contributing to a broader bearish outlook for the dollar.
Looking ahead, key economic indicators are set to influence the USD further. The release of US retail sales figures tonight is anticipated to reflect an expected 0.7% drop in sales growth. Should this prediction materialize, the dollar may struggle to regain momentum against its peers.
As the world's most traded currency, the USD serves as a benchmark for global markets, influenced by a myriad of factors, including monetary policy, economic data, and global risk sentiment. Experts emphasize that the Federal Reserve's interest rate policies play a crucial role; higher rates tend to attract investors, supporting strength in the dollar, while dovish policies can lead to a decline in demand.
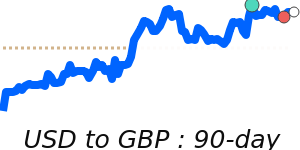
Currently, the USD is trading at 0.8655 against the Euro, which is 2.8% below its three-month average of 0.8905. This currency pair has shown relative stability, oscillating within a range of 0.8632 to 0.9299. Similarly, the USD to GBP exchange rate is at 0.7370, also down 2.3% from its three-month average of 0.7542, following a stable trading pattern between 0.7346 and 0.7859.
In the case of the USD to JPY, the current rate is at 144.7, sitting just below its three-month average, with trading maintaining a steadiness between 140.9 and 151.0.
Additionally, the recent rebound in oil prices has implications for the dollar, as movements in oil prices heavily influence the euro and associated cross-currency pairs. The price of Brent Crude oil is currently at 73.23, representing a 9.3% increase over the three-month average of 67.02. The oil market has experienced substantial volatility, trading within a vast 24.7% range from 60.14 to 75.02.
In summary, the outlook for the USD remains cautious as weak economic indicators and evolving risk sentiment shape its trajectory. Market participants are advised to keep a close eye on forthcoming economic data, as these releases will be critical in determining the dollar's direction in the coming days.